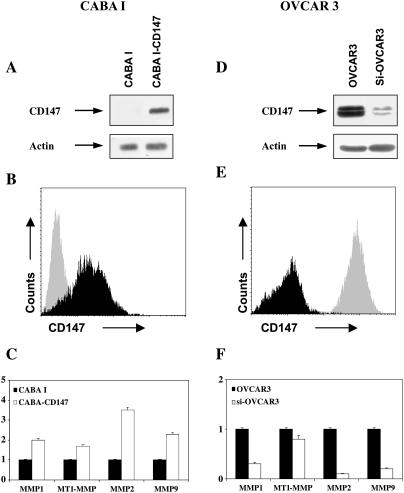
Figure 3.
(A, D) Western blot analysis of CD147 in CABA I and OVAR3 ovarian cancer cell lines. (B) Flow cytometry analysis of CD147 in CABA I: gray profile indicates control cells, whereas black profile indicates CD147-transfected cells. (E) Flow cytometry analysis of CD147 in OVCAR3 cells. Gray profile indicates control cells, whereas black profile indicates cells with silenced CD147 expression. (C, F) RT-PCR analysis of ovarian cancer cell lines for MMP-1, -2, and -9 and MT1-MMP mRNA expression. Control cells were arbitrarily set at 1.

