
FIGURE 3—
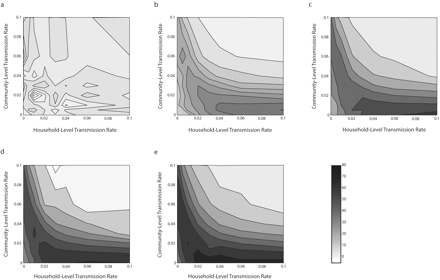
Contours of preventable fractions associated with improving water quality for different rates of household-level and community-level transmission.
Note. Each contour plot involves a different contamination rate (φ): 0 (a), 0.5 (b), 1.0 (c), 1.5 (d), and 2.0 (e).