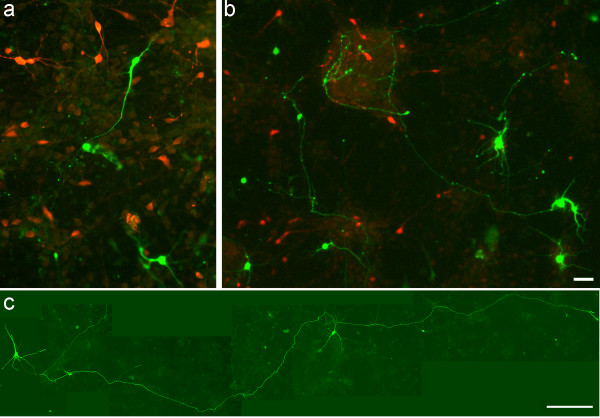
Figure 6.
Characterization of GFP labeled neurons in cortical cultures. (a, b) Representative images of GFP transfected control (a) and SDF-1 treated (b) cultures labeled for GABA immunoreactivity (red staining). (c) Image of a GFP+ neuron with an extended axon in SDF-1 treated culture. Scale bar: a, b, 30 μm; c, 150 μm.

