
Figure 4.
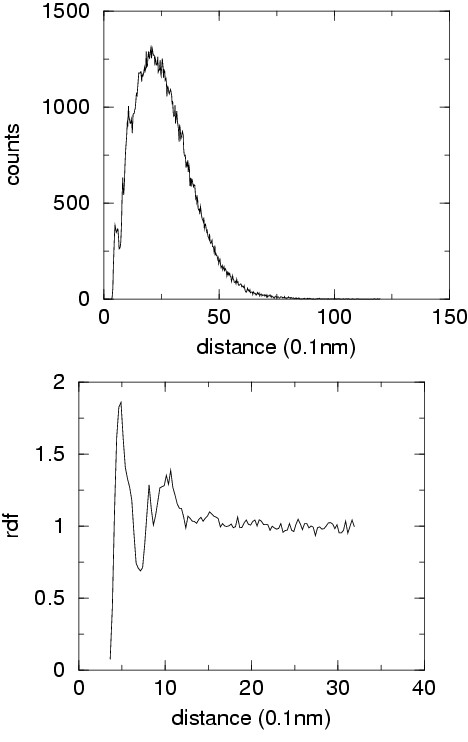
Original histogram of counts for the distances between the Ile and Ala sidechain centers of interaction (bin width = 0.25 Å) (upper panel). Computed radial distribution function (lower panel).
Official websites use .gov
A
.gov website belongs to an official
government organization in the United States.
Secure .gov websites use HTTPS
A lock (
) or https:// means you've safely
connected to the .gov website. Share sensitive
information only on official, secure websites.
Original histogram of counts for the distances between the Ile and Ala sidechain centers of interaction (bin width = 0.25 Å) (upper panel). Computed radial distribution function (lower panel).