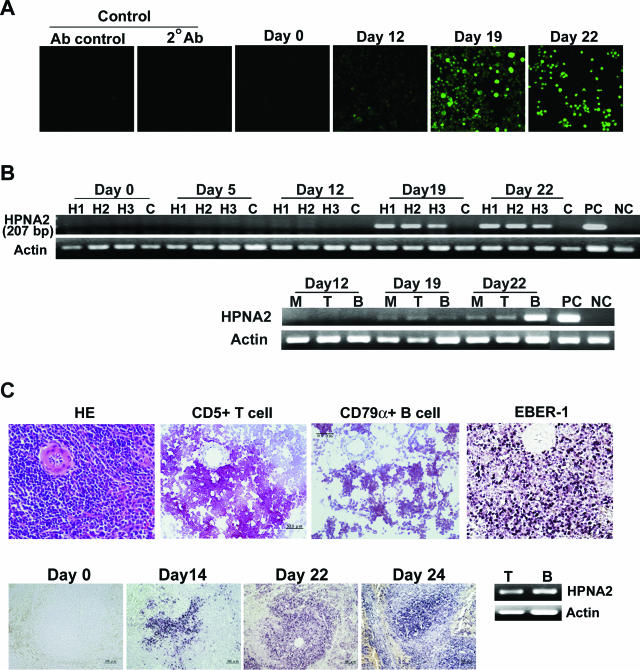
Figure 2.
Kinetics of antibody response against VCA and detection of HVP virus DNA and RNA. A: Anti-VCA antibodies in rabbit sera, as demonstrated by indirect immunofluorescence assay using commercial slides. Anti-VCA antibodies became detectable on day 19 after HVP inoculation. Control studies included different species antibody control (Ab control, anti-mouse IgG FITC) and secondary antibody control (two Abs, goat anti-rabbit IgG FITC). B (top): Detection of HVP-EBNA2 gene (207 bp) in rabbit PBMCs at different time points after virus inoculation. H1, H2, and H3: PBMCs from three rabbits inoculated with HVP. C: Uninfected control rabbit. PC: 594S cells (HVP-producing cells as positive control); NC: U937 cells as negative control. By immunomagnetic purification of CD5+ T cells, IgM+ B cells, and CD14+ monocytes, HVP-EBNA2 could be detected in the fractions of purified T cells (T), B cells (B), and monocytes (M) of PBMCs (B, bottom) in HVP-infected rabbits since day 19 after virus inoculation. C (top): Specific lymphoid maker (CD79α and CD5) staining as well as EBER1 in situ hybridization on spleen cells on day 22 after HVP inoculation. C (bottom): HVP EBER1 in situ hybridization on different time points after HVP inoculation. The EBER1-positive signals appeared first in the marginal zones of white pulp of spleen and increased in numbers thereafter. HVP DNA could be detected in both T and B cells obtained from splenocytes collected on day 22 after HVP inoculation (C, bottom right). By real-time PCR analysis, the mean of virus load in B cells was 414 copies per 100 ng of cell DNA, higher than the 225 copies in T cells. Original magnifications: ×200 [A, C (top)]; ×100 (C, bottom).

