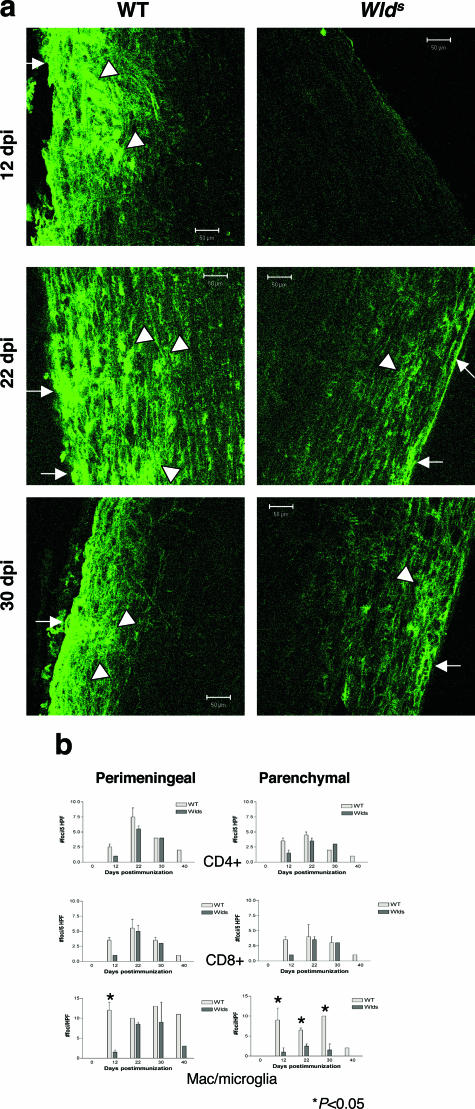
Figure 3.
Reduced accumulation and activation of macrophages/microglia in the CNS in Wlds mice during EAE. a: Representative photomicrographs of spinal cord sections taken from WT and Wlds mice at days 12, 22, and 30 after immunization with MOGp35-55 and stained for Lectin-B4. Sections from WT mice show both perimeningeal/perivascular (arrowheads) and parenchymal infiltrates (white arrows) of cells from days 12 to 30. In contrast, sections from Wlds mice lack macrophage/microglia infiltrates at day 12 and have fewer parenchymal infiltrates at other time points. b: Quantification of perimeningeal and parenchymal infiltrates of CD4 T cells, CD8 T cells, and macrophage/microglia from Wlds and WT mice during the course of EAE showed that perimeningeal (P < 0.05) and parenchymal infiltrates (P < 0.05) of macrophages/microglia were significantly less in Wlds mice at day 12 after immunization. In addition, at later time points, parenchymal infiltration (d22, P < 0.05; d30, P < 0.05) of macrophages/microglia in sections from Wlds mice was significantly reduced compared with WT mice. In contrast, perimeningeal and parenchymal infiltrates of CD4 and CD8 cells were similar in both groups at all time points. Statistical analysis was performed using unpaired Student’s t-test. Original magnifications, ×20.

