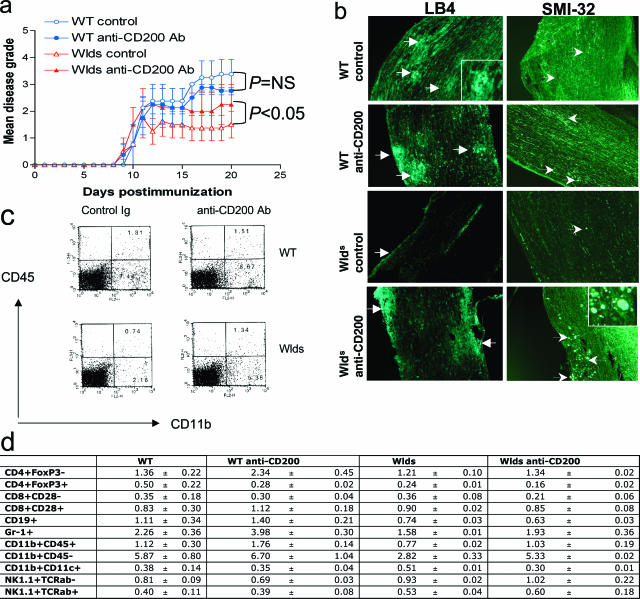
Figure 9.
Treatment of Wlds mice with blocking anti-CD200 antibody results in worsened EAE with increased macrophage/microglia infiltrates in the CNS. After the induction of EAE, Wlds and WT mice were treated with 200 μg/100 μl of blocking anti-CD200 antibody injected intravenously every other day from days 10 to 20. Control WT and Wlds mice were treated with PBS alone. Eight mice per treatment group were evaluated. a: Wlds mice treated with anti-CD200 antibody experienced a more severe disease course than untreated Wlds mice (P < 0.05, Student’s t-test—area under the curve). In comparison, disease in WT mice was similar even after treatment with anti-CD200 antibody (P = NS, Student’s t-test). b: Spinal cord sections harvested at day 20 from treated and control mice demonstrate enhanced immunofluorescence staining of macrophages/microglia (white arrows) in the CNS of anti-CD200-treated Wlds mice compared with Wlds controls. Macrophage/microglia staining was similar in treated and untreated WT mice. Immunofluorescence staining demonstrates more SMI-32-positive axonal ovoids (white arrows) in the spinal cord white matter of treated Wlds mice, compared with untreated controls. c and d: We performed flow cytometric analysis of immune cell populations in the spinal cords isolated from WT and Wlds mice treated with anti-CD200 antibody or rat IgG control antibody (days 10 to 20) on day 20 after immunization. The results from three to four mice per group were averaged and are shown in table form in d. Also shown is a representative FACS analysis of spinal cords from WT and Wlds mice treated with control Ig or anti-CD200 antibody and stained with CD11b-phycoerythrin and CD45-allophycocyanine (APC) antibodies (c). Original magnifications, ×10.

