
Figure 3.
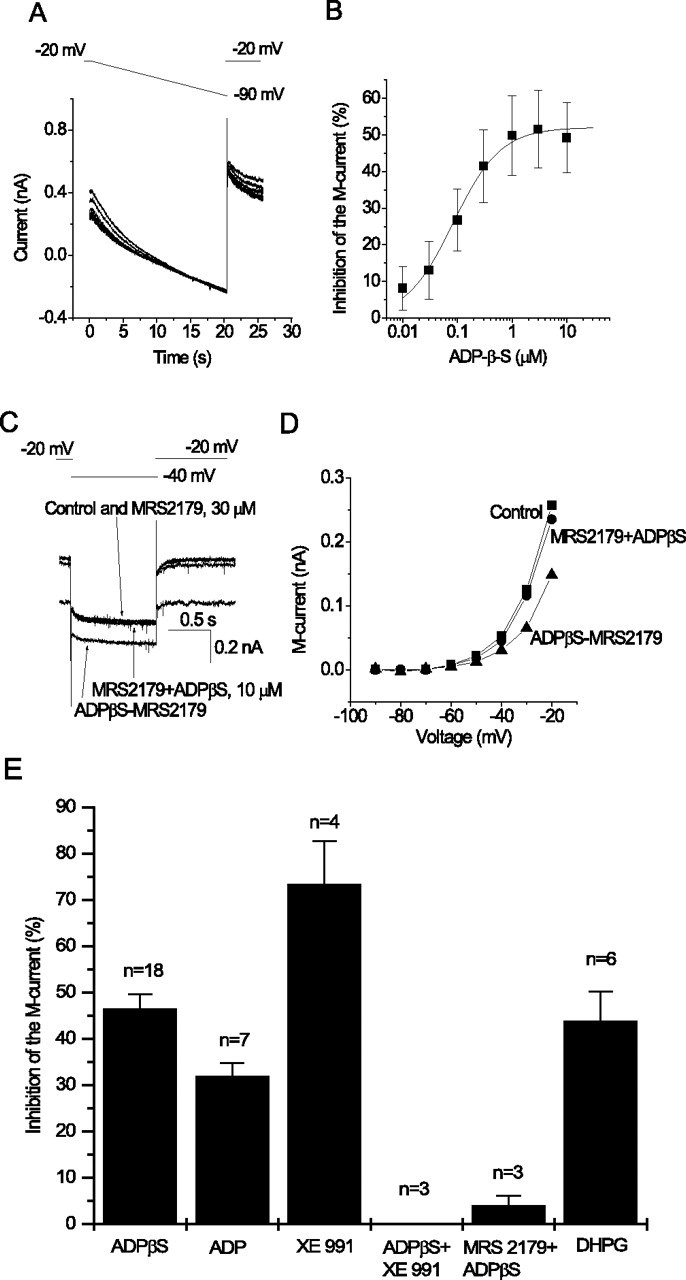
Characteristics of the M-current inhibition mediated by P2Y1 receptors on hippocampal pyramidal neurons. A, Currents recorded in response to voltage ramps (20 s) from −20 to −90 mV (voltage protocol above) applied in the presence of increasing concentrations of ADPβS. Note the progressive reduction in outward rectification in the evoked current. B, Concentration dependence of M-current inhibition, measured as percentage reduction of ramp-evoked current at −30 mV, after leak subtraction by extrapolation of the linear part of the ramp I–V relationship negative to −60 mV. Points show mean ± SEM from three cells. Increasing concentrations of ADPβS were added cumulatively using 1 min exposure times. Curves were fitted to pooled data points using Origin 5 software to the following Hill equation: y = ymax × xnH/(xnH + KnH), where y is the observed percentage inhibition, ymax is the extrapolated maximal percentage inhibition, x is the nucleotide concentration (micromolar), K is the IC50 (micromolar), and nH is the Hill coefficient. Mean values of constants were ymax of 52.1 ± 1.8%, K of 84.0 ± 12.7 nm, and nH of 1.0 ± 0.1. C, The specific P2Y1 receptor antagonist MRS 2179 prevents inhibition of M-current by ADPβS. M-current deactivations recorded as in Figure 1A. Currents were recorded before and after adding MRS 2179 (30 μm) alone, then after adding ADPβS (10 μm) in the presence of MRS 2179, and then on adding ADPβS after washing out MRS 2179. D, Current–voltage relationships (determined as in Fig. 1) before adding drugs (squares) or after adding ADPβS in the presence of MRS 2179 (circles) and then on adding ADPβS after washing out MRS 2179 (triangles). E, Mean percentage inhibition of M-current by the P2Y1 agonists ADPβS and ADP (10 μm each), the M-channel blocker XE991 (3 μm), ADPβS (10 μm) in the presence of XE991 (3 μm), ADPβS (10 μm) in the presence of the P2Y1 antagonist MRS 2179 (30 μm), and the group 1 metabotropic glutamate receptor agonist DHPG (10 μm). Error bars show SEM of inhibition of the M-current by the drugs indicated measured at −30 mV from steady-state current–voltage relationship or from deactivation tail amplitude (n indicates the number of cells tested).