Figure 1.
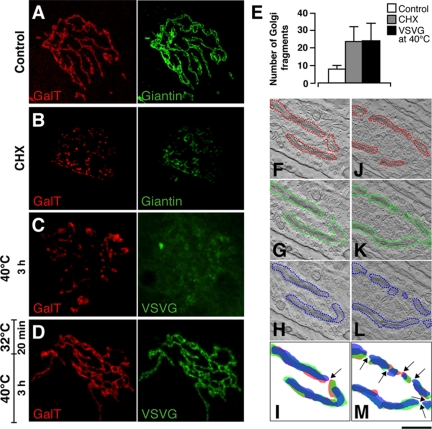
Fragmentation of the Golgi ribbon in the absence of membrane input from the ER. (A) At steady state at 37°C, the distribution patterns of GalT (red) and giantin (green) show a continuous reticulum in HFs. (B) After CHX treatment for 3 h, these Golgi-resident proteins reveal the GC as fragmented into discrete elements. (C) With VSV-infected cells incubated at 40°C for 3 h, fixed, and stained for GalT (red) and VSVG (green), the staining pattern of GalT is again fragmented, and VSVG is retained in the ER. (D) When cells in C were then incubated at 32°C for 20 min, fixed, and stained for GalT (red) and VSVG (green), GalT reveals a continuous ribbon, and VSVG is transported to the GC. (E) Quantitation of GC fragmentation as shown in A–C, showing number of isolated GalT-labeled structures seen under LSCM using the Z-stacking procedure (after background subtraction). (F–M) HFs were infected with VSV, kept at 40°C for 3 h to accumulate VSVG in the ER (F–M). They were then either fixed (J–M) or placed at 15°C to accumulate VSVG in the intermediate compartment for 15 min and finally shifted to 40°C to allow VSVG accumulated in the intermediate compartment to move through the Golgi for 8 min (F–I). The cells were then processed for electron tomography. Cells with similarly oriented GC are shown. Superimpositions of Golgi profiles (red) of the first (red), 15th (green), and the 31st (blue) virtual serial sections from the same tomogram are shown. Arrows indicate the breakpoints in the ribbon. Quantitative analysis showed that the number of the ribbon breakpoints is 2.5-fold higher in cells incubated at 40°C. Bar, 2 μm (A); 0.7 μm (C).

