Figure 7.
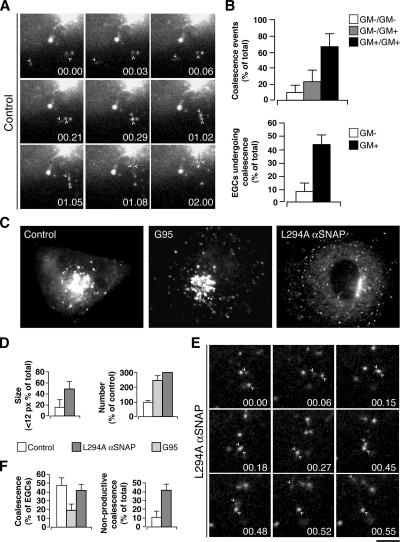
Dynamics of GM130-positive EGCs in COS7 cells. (A) Peripheral motile structures in cells expressing GFP-GM130 (control) were imaged under time-lapse microscopy. Selected frames shown at the indicated times; arrowheads indicate structures that coalesce (00.03–00.29) and then move together (01.02–01.08) until they are no longer resolvable (02.00). (B) Quantitation of coalescence events attributable to GM130-positive (GM+) and GM130-negative (GM−) EGCs and of EGCs of each category exhibiting coalescence events. Cells were cotransfected with VSV-YFP and CFP-GM130, kept at 40°C for 12 h, then shifted to 32°C, and after 5 min imaged under time-lapse microscopy. (C–F) GFP-GM130–expressing cells (Control), GFP-G95–overexpressing cells (G95), and GFP-GM130–expressing cells injected with the mutant αSNAP L294A were fixed (C and D) or imaged under time-lapse microscopy (E and F). (D) Quantitation for size and number of GM130-positive EGCs as shown in c (as indicated). (E) Nonproductive coalescence events of EGCs in cells expressing GFP-GM130 and injected with αSNAP L294A under time-lapse microscopy. Two EGCs (arrowheads) apparently converge and coalesce (00.006–00.27), then rapidly diverge (00.45, 00.48) and move separately to different destinations (00.52, 00.55). (F) Quantitation of the total coalescence events and nonproductive coalescence events as shown in C and E (as indicated). Bar, 3 μm (A and E), 10 μm (C).

