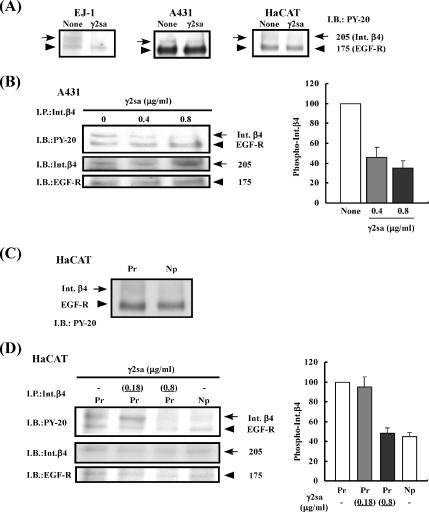
Figure 4.
Inhibitory effect of γ2sa on EGF-induced phosphorylation of integrin β4. (A) Serum-starved EJ-1, A431, or HaCaT cells were suspended in serum-free DMEM/F-12 medium and inoculated into culture dishes that had previously been coated with 0.5 μg/ml Pr-LN5 and then blocked with BSA. After incubation for 1.5 h, the cultures were added with 0.05 μg/ml EGF and without (None) or with 0.4 μg/ml soluble γ2sa (γ2sa). After further incubation for 10 min, cell lysate was prepared from each culture. The samples were subjected to SDS-PAGE and subsequent immunoblotting (I.B.) with a mAb against PY-20. The 175-kDa band was identified as EGF receptor (EGF-R), and the 205-kDa band was identified as integrin β4 (Int.β4), as shown below. Other experimental conditions are described in Materials and Methods. (B) A431 cells were treated with 0.4 or 0.8 μg/ml γ2sa and 0.05 μg/ml EGF on the Pr-LN5 substrate. Integrin β4 present in the cell lysates was subjected to immunoprecipitation (I.P.) with the anti-integrin β4 mAb 3E1. The immunoprecipitates were analyzed by immunoblotting with the antibodies against PY-20, integrin β4 (Int.β4) and EGF-R (left). Relative intensity of the 205-kDa immunosignal for the integrin β4 phosphorylation was determined using the NIH Image software (right). Each value represents the mean intensity ± SD of three separate experiments. The relative intensity of the control culture (None) was regarded as 100. (C and D) Serum-starved HaCaT cells were treated with 0.18 or 0.8 μg/ml soluble γ2sa in addition to 0.05 μg/ml EGF in culture dishes that had been pre-coated with 1 μg/ml Pr-LN5 (Pr) or Np-LN5 (Np) as described above. The tyrosine phosphorylation of integrin β4 (arrows) and EGF receptor (arrowheads) in the cell lysates were analyzed before (C) and after (D) immunoprecipitation with the anti-integrin β4 mAb 3E1.

