Figure 5.
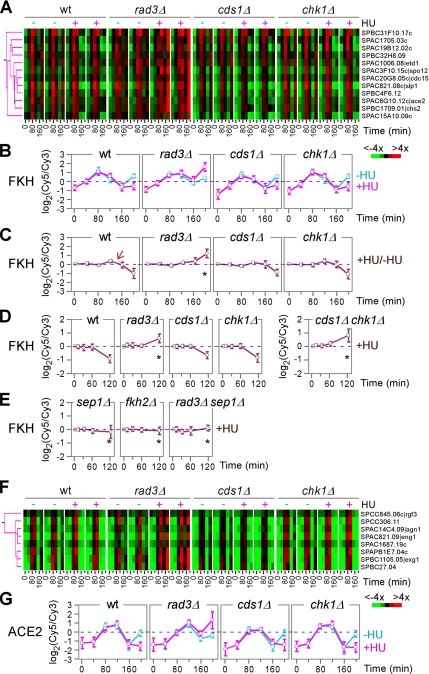
The FKH- and ACE2-clusters. (A) Magnified view of the FKH-cluster as in Figure 2B. Individual genes in the cluster are shown on the right. (B–E) Average expression profiles of the FKH-cluster. The x- and y-axis indicate expression ratios and time points after HU treatment, respectively. An arrow indicates the time of expression level changes. Asterisks indicate the defect in expression induction. Expression levels of the FKH-cluster in synchronized cells supplemented with HU (+HU) and without (−HU) are separated compared with a common reference (B). Expression levels in HU-treated samples as in B are directly compared with those in the control (C). Expression levels of the FKH-cluster in asynchronized cells supplemented with HU are compared with those without HU (D and E). (F) Magnified view of the ACE2-cluster as in Figure 2B. Individual genes in the cluster are shown on the right. (G) Average expression profiles of the ACE2-cluster. The x- and y-axis indicate expression ratios and time points after HU treatment, respectively. Expression levels of the histone-cluster in synchronized cells supplemented with HU (+HU) and without (−HU) are separated compared with a common reference.

