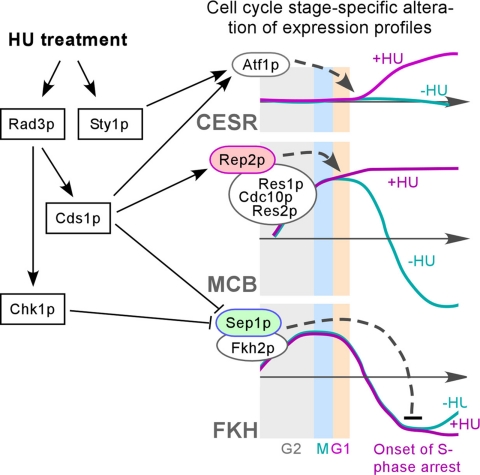
Figure 7.
Schematic model for HU-induced expression responses. Kinases Rad3p, Cds1p, Chk1p, and Sty1p are shown in rectangles and transcription factors are in ovals. Kinases directly or indirectly regulate transcription factors. Arrows and blunted lines indicate positive and negative regulations, respectively. Expression profiles of the CESR-, MCB-, and FKH-clusters in presence (+HU) and absence (−HU) of HU are shown.

