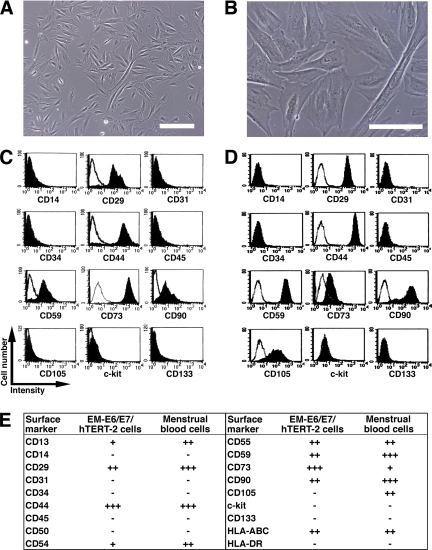
Figure 1.
Surface marker expression of endometrium-derived cells. (A and B) Morphology of menstrual blood–derived cells, regarded as being PD 1 or 2. Scale bars, 200 μm (A), 100 μm (B). (C and D) Flow cytometric analysis of cell surface markers of EM-E6/E7/hTERT-2 cells (C) and menstrual blood–derived cells (D). (E) Further phenotypic analysis in EM-E6/E7/hTERT-2 cells and menstrual blood–derived cells are summarized. Peak intensity was estimated in comparison with isotype controls. +++, strongly positive (>100 times the isotype control); ++, moderately positive (<100 times but more than 10 times the isotype control); +, weakly positive (<10 times but more than twice the isotype control); −, negative (less than twice the isotype control).

