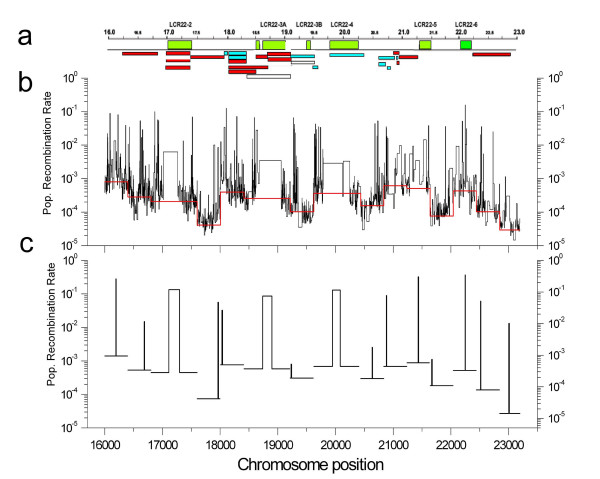
Figure 4.
Comparison between the population-based linkage-disequilibrium map and the pedigree-based linkage map. A, An outline of the pedigree-based linkage map according to Figure 1. B, Population based linkage-disequilibrium SNP map. The map was constructed using genotype information publicly available from the HapMap project site http://www.hapmap.org, for a total of 2074 SNPs of 60 unrelated individuals corresponding to parents of the CEPH dataset (Utah residents with ancestry from northern and western Europe; CEU). Background population recombination rate (ρ) per base pair and the factor by which the recombination rate between two adjacent SNPs exceeds the background rate (λ) were estimated for each window by the PHASE v2.1.1 software using the general model for recombination rate variation (-MR0 option). We plotted the ρ value for each window (red line) and the λρ value for each SNP interval (black line). C, The presence of a recombination hotspot was estimated for each window using the simple hotspot model for recombination (-MR1 option). We estimated ρ and λ inside the hot spot region and the hot spot boundaries defined by their left and right ends and plotted the λρ value across each window (black lines).

