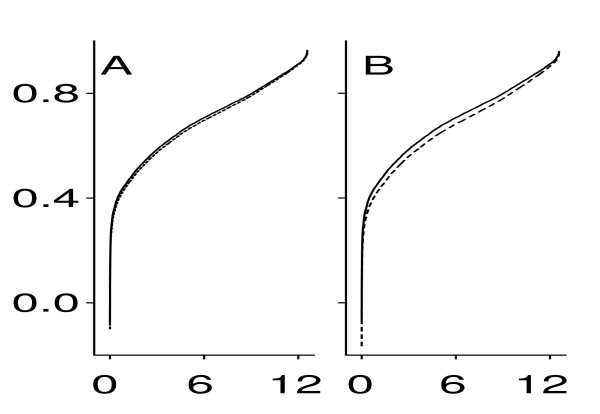
Figure 3.
Correlation coefficients (in increasing order) estimated in all gene pairs formed by gene SLC25A24. x-axis: ordered pair number (× 1000), y-axis: correlation coefficient. Solid line: original correlation coefficients; dashed line: correlation coefficients corrected for a log-additive random noise with σε = 0.1 (A) and σε = 0.15 (B) in accordance with formula (3).

