
Figure 1.
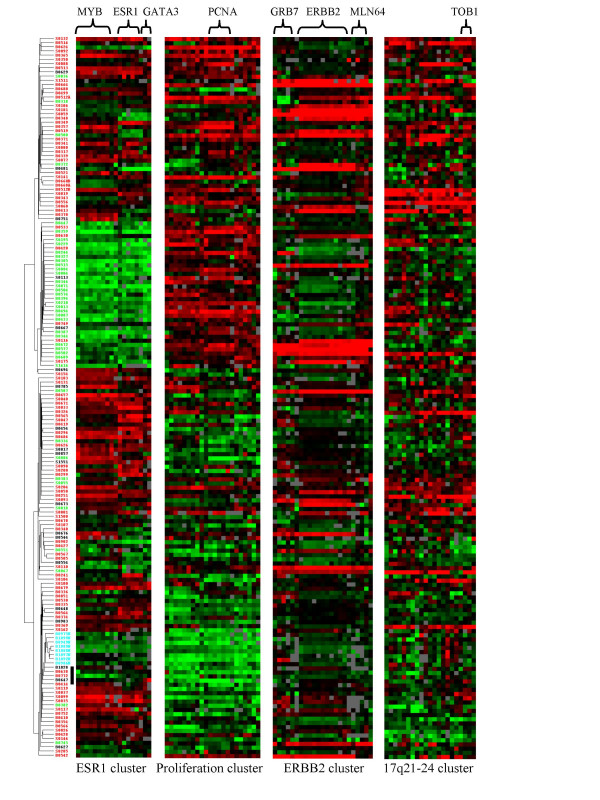
Unsupervised hierarchical clustering of 162 breast tumor samples based on ~4,000 genes with greatest variation. Tumor samples (left) are color coded according to immunohistochemical staining for estrogen receptor (ER negative, green; ER positive, red; reduction mammoplasties, cyan; ER status unknown, black). Gene clusters (top) are those related to estrogen receptor (ESR1), proliferation-associated genes, ERBB2 related genes, and genes found in a common chromosomal region of 17q21-24 (red represents high relative expression, green low relative expression). The black bar indicates samples that clustered tightly with normal specimens.