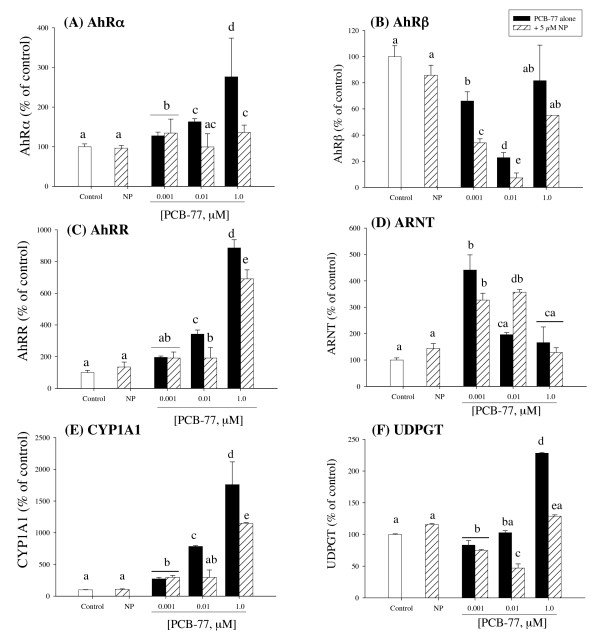
Figure 2.
Expression of AhRα (A), AhRβ (B), AhRR (C), ARNT (D), CYP1A1 (E) and UDPGT (F) mRNA in primary culture of salmon hepatocytes exposed for 48 h to 5 μM NP and PCB-77 at 0.001, 0.01 and 1 μM, singly and in combination. Messenger ribonucleic acid (mRNA) levels were quantified using quantitative (real-time) PCR with gene specific primer pairs. The data are given as % of the solvent control ± standard error of the mean (n = 3). Different letters denote exposure group means that are significantly different for the respective mRNA expression using ANOVA followed by Tukey's multiple comparison test (p < 0.05).

