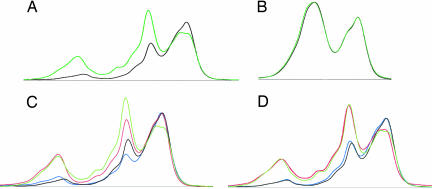
Fig. 5.
DHPLC elution profiles of double-stranded DNA amplified from cDNA obtained from kidney cancer and adjacent normal tissues. mRNA isolated from cancerous and adjacent normal kidney tissues from the same patient were reverse-transcribed, and the double-stranded cDNA PCR-amplified by using primers specific to the ENO1 gene (A) and the TMSB4X gene (B) was loaded on a DHPLC system. DNA elution was followed by absorbance (mV) in function of retention time (minutes). Normal and cancerous elution profiles are shown in green and black, respectively. Variations due to repeated PCR applied to ENO1 cDNA are shown in C (green and red, normal; black and blue, cancer). Variations due to DHPLC loading of the ENO1 PCR products are shown in D with the same color coding.

