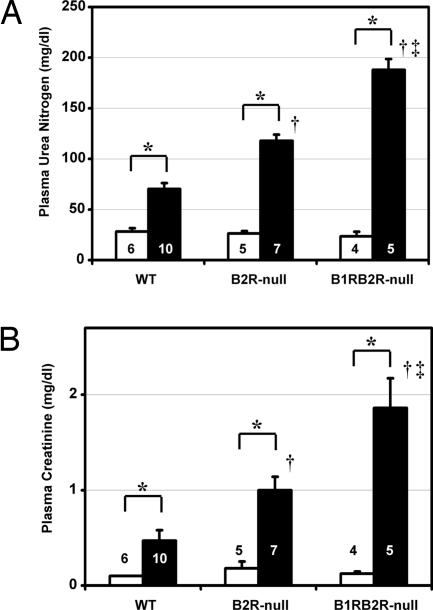
Fig. 3.
Plasma levels of urea nitrogen (A) and creatinine (B) as indices of renal excretory function in WT, B2R-null, and B1RB2R-null mice. White and black columns indicate sham-operated and ischemia groups, respectively. ∗, P < 0.05 vs. the sham-operated group of the same genotype; †, P < 0.05 vs. WT; ‡, P < 0.05 vs. B2R-null. The data are means ± standard errors; the numbers of animals are shown in white or black digits.

