
Figure 1. Negative relationships between the degree of intermale variation in sperm morphology and the level of postcopulatory sexual selection (see Table 1).
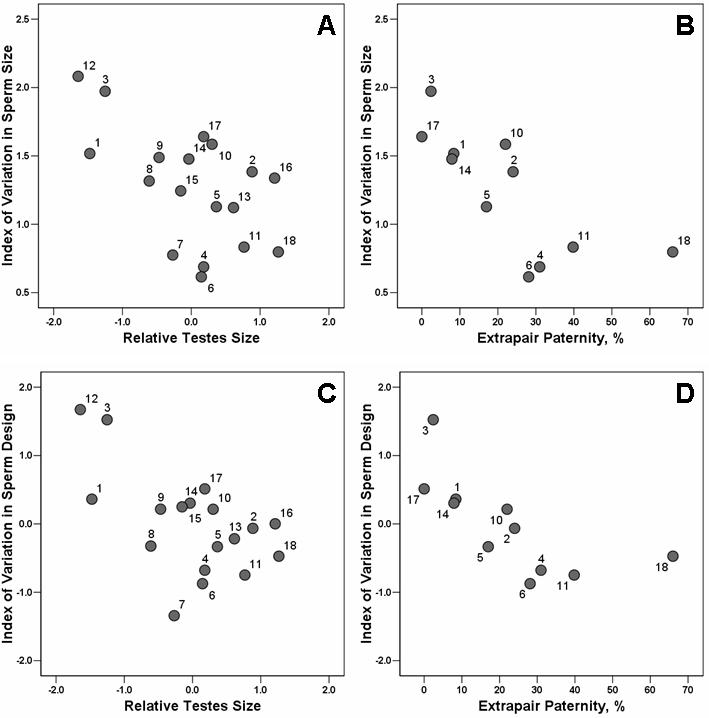
(A) Intermale variation in sperm size is negatively associated with relative testes size (p = 0.003, n = 18). (B) Intermale variation in sperm length is negatively associated with levels of extrapair paternity (p<0.001, n = 11). (C) Intermale variation in sperm design is negatively associated with relative testes size (p = 0.004, n = 18). (D) Intermale variation in sperm design is negatively associated with levels of extrapair paternity (p = 0.006, n = 11). All analyses were performed controlling for phylogeny and sample size using Generalised Least-Squares Models and transformed variables. Relative testes sizes refer to residuals from a regression of log-transformed combined testes mass on body mass. Extrapair paternity levels refer to percent of offspring not sired by the alpha male. See Methods for more details. Species list (n values refer to the number of individual males sampled): 1, Ficedula hypoleuca (n = 40); 2, Prunella modularis (n = 56); 3, Taeniopygia guttata (n = 51); 4, Quelea quelea (n = 236); 5, Fringilla coelebs (n = 47); 6, Agelaius phoeniceus (n = 38); 7, Seiurus aurocapillus (n = 10); 8, Mniotilta varia (n = 10); 9, Protonotaria citrea (n = 10); 10, Geothlypis trichas (n = 10); 11, Setophaga ruticilla (n = 10); 12, Phyrrula phyrrula (n = 19); 13, Carduelis flammea (n = 12); 14, Acrocephalus shoenobaenus (n = 15); 15, Acrocephalus scirpaceus (n = 14); 16, Sylvia atricapilla (n = 10); 17, Zosterops lateralis (n = 42); 18, Malurus cyaneus (n = 59).