
Fig. 2.
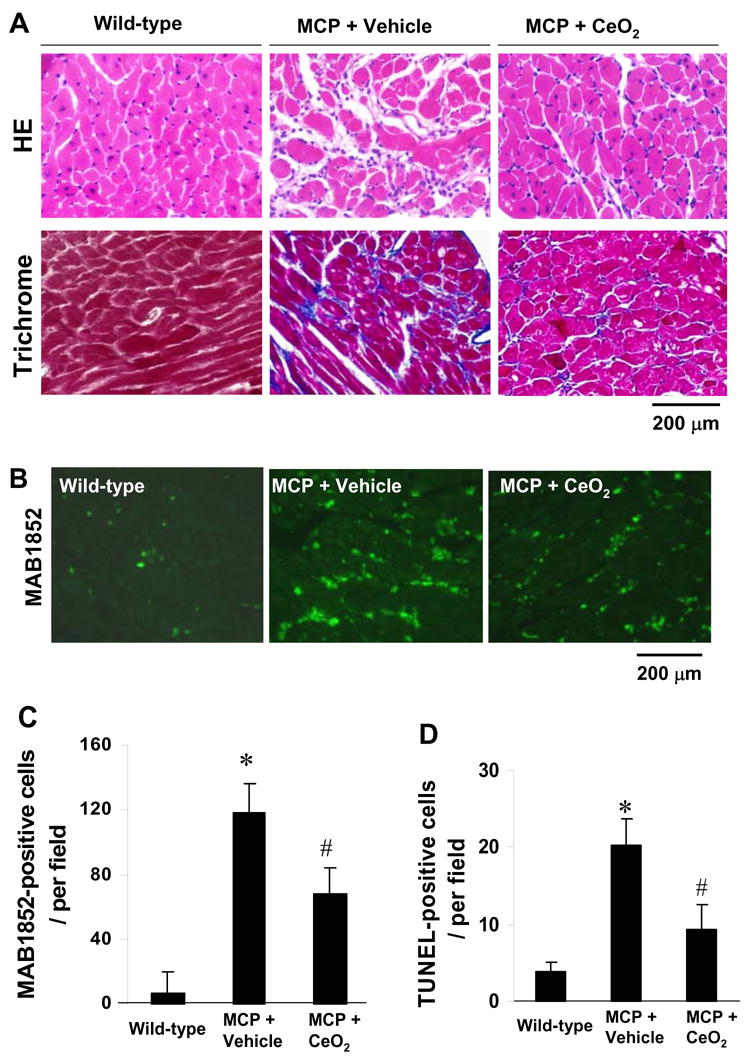
Effects of CeO2 nanoparticles on myocardial inflammation. (A) Histopathological photomicrographs of LV obtained from wild-type control, vehicle- and CeO2-treated MCP mice. Upper panel, H.E staining; Lower panel, Masson’s trichrome staining, blue represents collagen deposition. (B) Representative immunohistochemical photomicrographs of monocyte/macrophage infiltration in the myocardium. Green denotes infiltrated monocyters/macrophages. (C, D) Histograms showing the number of MAB1852-positive cells and TUNEL-positive cells in the myocardium of different group of mice, respectively. *P < 0.001 versus wild-type controls; #P<0.05 versus vehicle-treated MCP mice; n=5 per group.