
Fig. 4.
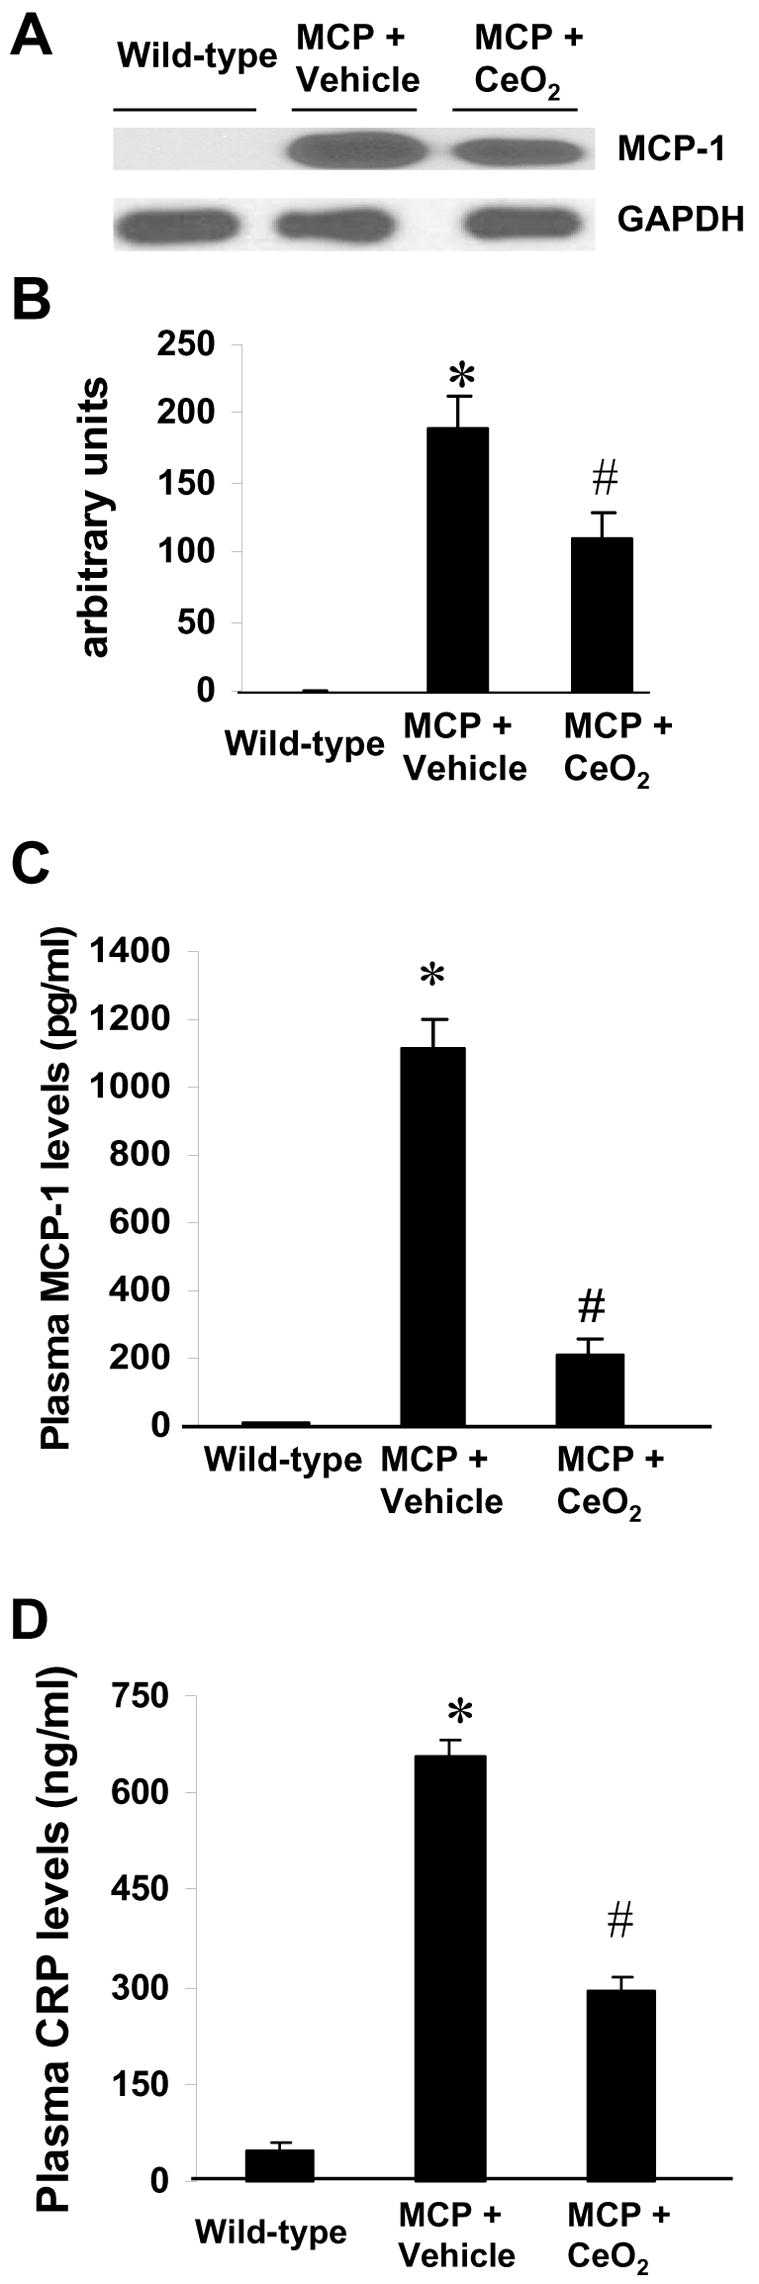
Effects of CeO2 nanoparticles on MCP-1 expression and release. (A) Immunoblot showing levels of MCP-1 in the myocardium of wild-type control, vehicle-, and CeO2-treated MCP mice. (B) Summary of densitometric analysis of data in A. *P < 0.001 versus wild-type control; #P<0.05 versus vehicle-treated MCP mice and wild-type controls; n=5 per group. (C–D) Circulating levels of MCP-1 and CRP assayed by ELISA. *P < 0.001 versus wild-type control; #P<0.05 versus vehicle-treated MCP mice and wild-type controls; n=6 per group.