
Figure 5. FoxOs regulate liver EC angiogenic response through Sprouty2.
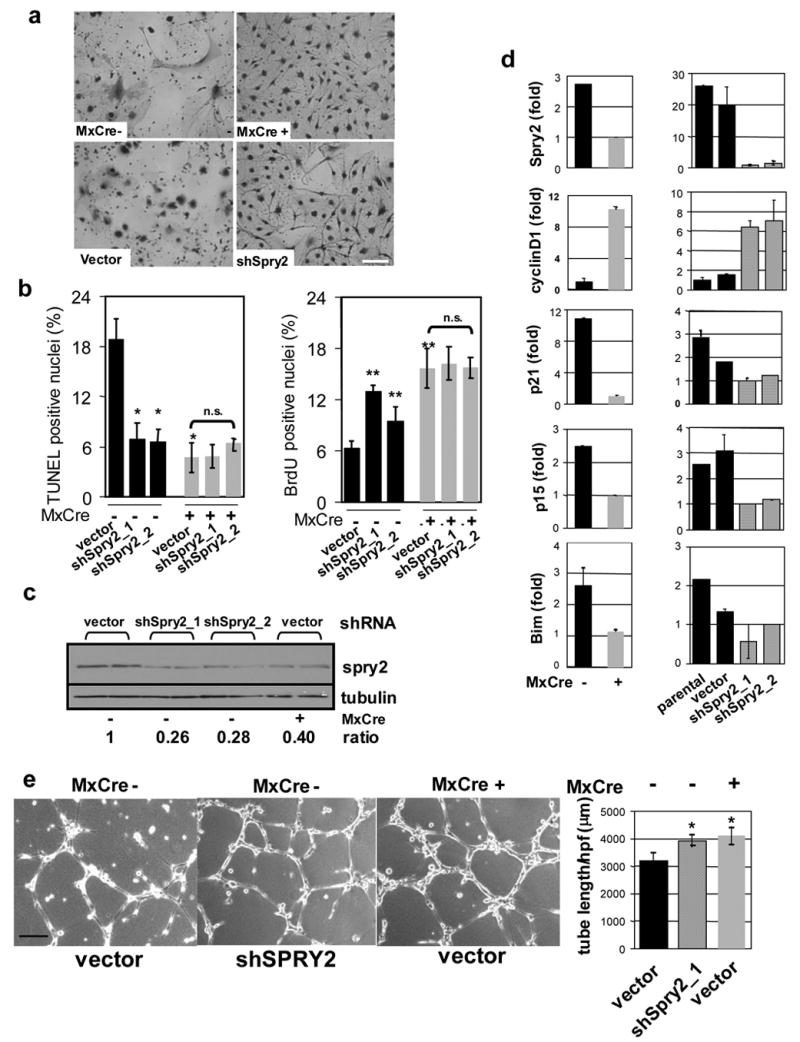
a, Growth advantage of Mx-Cre+over Mx-Cre− liver ECs after 10 days culture. Sprouty2 knockdown in Mx-Cre− liver ECs had similar effect. Bar=15μm. b, TUNEL and BrdU. Knockdown of Sprouty2 (shSpry2_1 &_2, shRNAs) in Mx-Cre− liver ECs phenocopies cell growth and apoptosis phenotypes in Mx-Cre+ liver ECs; * indicates p<0.01; error bars represent ± s.e. c, knock-down of endogenous Sprouty2 protein expression in Mx-Cre− liver ECs by shSpry2. Two independent replicates are shown. Band densities were measured by ImageJ and normalized to tubulin. Ratio indicates normalized values over that of control (vector infected Mx-Cre− EC). d, Correlation of Sprouty2 expression with cyclinD1, p21, p15, Bim level in liver ECs by quantitative PCR analysis. Knockdown of Sprouty2 with two different shRNAs (shSpry2_1 &_2) recapitulates above differences for cyclinD1, p21, p15, and Bim relative to parental untreated and vector-only controls (lower panels). Results shown are from triplicate experiments; error bars represent ± s.e. e, VEGF-induced tube formation in liver ECs. Bar=100 μm. Average tubule length/HPF (±s.d.) measured by ImageJ software in multiple microscopic fields was plotted (*, p<0.01 versus vector infected Mx-Cre− EC).