
Figure 5. The B-factors of the crystal structure correlate with H/D exchange protection data.
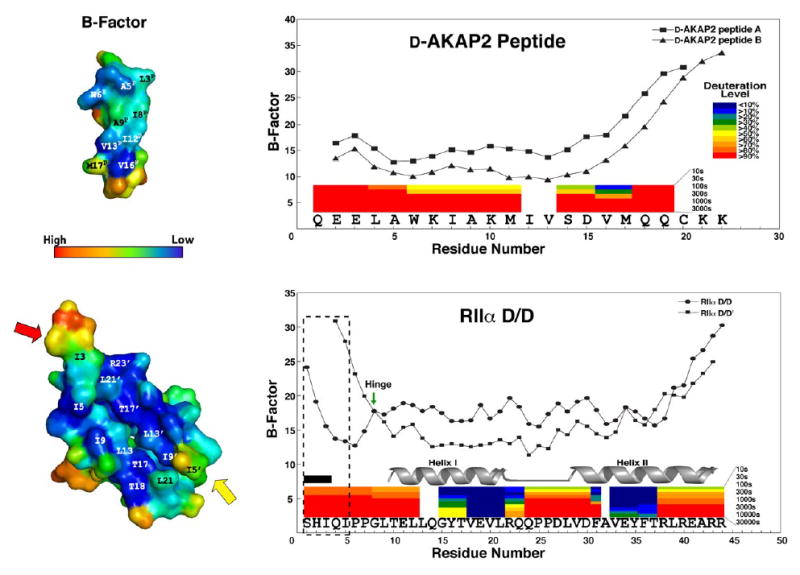
B-factors of both RIIα D/D domain and D-AKAP2 peptide are shown. We see a sharp rise in B-factor at the C-terminus of the peptide, which corresponds with a high deuteration rates demonstrated by previous H/DMS experiments (Burns-Hamuro et al., 2005). The colored bars represent the deuteration levels of peptides from D-AKAP2 AKB (631–649) in complex with RIIα D/D domain and the peptides of RIIαD/D domain in the presence of the peptide. In addition, we see elevation in B-factors at the termini of the RIIα D/D domain, which corresponds to high deuteration rates as well. The flexible N-terminus (1–5) is boxed to show the differences between the two protomers. RIIαD/D’ exhibits higher B-factors for residues 4 and 5 and residues 1–3 are disordered (labeled by the black box), suggesting great flexibility for this region. Gly 8 is marked with an arrow, because it may act as a hinge for the flexible N-terminus. The helix I and helix II are highly protected when bound to the AKAP.