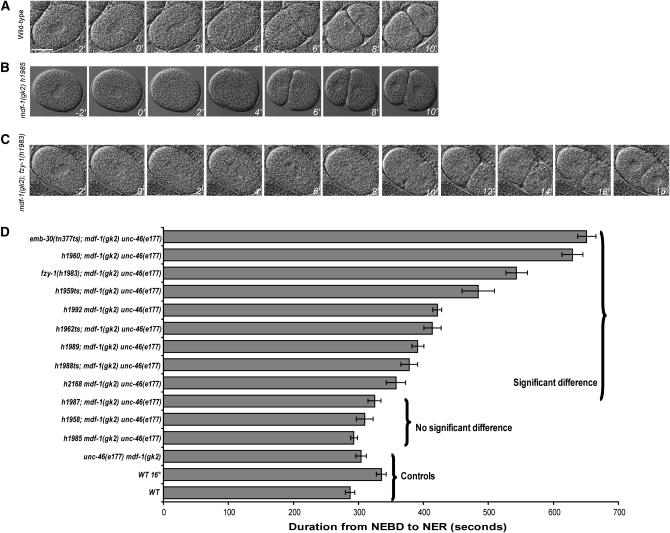
Figure 2.—
Timing of cell division at one-cell stage in suppressors. (A–C) Images of the wild-type, unc-46(e177) mdf-1(gk2) h1985, and unc-46(e177) mdf-1(gk2); fzy-1(h1983) one-cell embryos using time-lapse microscopy. The T = 0 min time point shows cells during NEBD. The embryos were imaged every 2 min from this point until the formation of the two-cell embryo. Pictures were taken every 2 min (bar, 20 μm). (D) Summary of the mitotic timing data from live cell imaging. Bars represent the duration of mitotic division from NEBD to NER in one-cell embryos. Mean durations are plotted in seconds with SEM error bars (n = 10 measurements for each strain). The braces depict the controls, the suppressors that do not cause a significant delay in mitotic progression, and the suppressors that significantly delay the mitotic timing as shown by P-values of Student's t-test statistic (supplemental Table 1 at http://www.genetics.org/supplemental/). All the measurements were performed at 20°, except for emb-30(tn377ts) and wild-type control strains observed at 16°.

