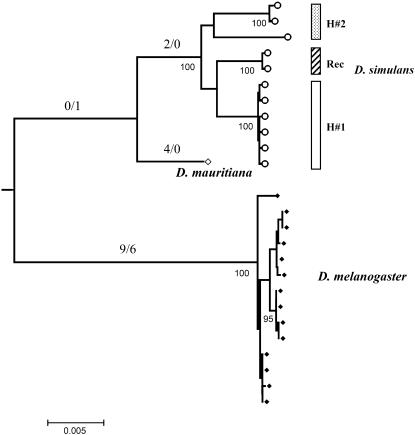
Figure 5.—
Neighbor-joining tree of the OS region reconstructed using Jukes and Cantor corrected distances. D. simulans and D. melanogaster sequences are depicted as open circles and solid diamonds, respectively. Bootstrap values >90% are shown under the branches, and X/Y values represent the maximum-likelihood estimates of the number of synonymous and nonsynonymous changes, respectively. H#1, haplogroup 1; H#2, haplogroup; Rec, putative recombinant sequences.

