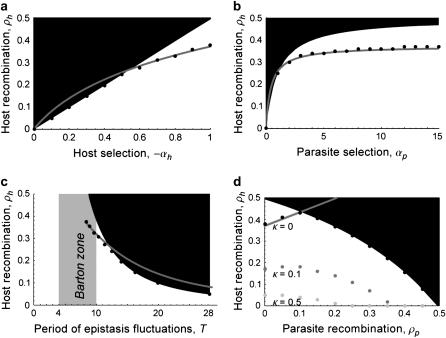
Figure 3.—
Evolutionarily stable host recombination rate in the two-species coevolutionary model as a function of (a) the strength of selection on the host, (b) the strength of selection on the parasite, (c) the period of the coevolutionary cycles, and (d) the parasite recombination rate. The ES values obtained from simulations (circles) are compared to Equation 34 (shaded curve). When recombination is so frequent that R < 1 (see Equation 36), the coevolutionary cycles and, hence, selection on recombination vanish (solid area). Except for the parameters illustrated on the horizontal axes, default parameters of  ,
,  ,
,  ,
,  , and
, and  were used (in c,
  was varied as in a, from which the period was calculated). In d, we also incorporate different intrinsic costs of recombination (see Equation 44): κ = 0 (solid circles), κ = 0.1 (dark-shaded circles), and κ = 0.5 (light-shaded circles ).

