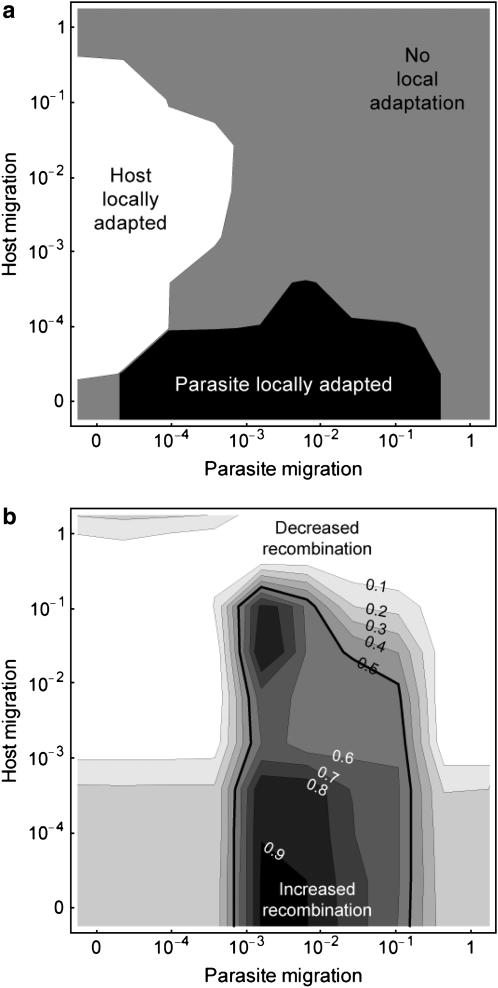
Figure 4.—
Effect of host and parasite migration rates on (a) parasite local adaptation and (b) the evolution of a modifier of recombination in the host. These results are obtained from numerical simulations of a stochastic version of the Nee coevolutionary model in a metapopulation. We considered 50 host and parasite populations of equal size (1000 individuals in each population), connected by host and parasite migration. In a we plot the level of local adaptation: in the solid area the parasite is locally adapted ( ); in the shaded area there is no local adaptation (
 ); in the open area the parasite is locally maladapted (
 ). In b we plot the frequency of a modifier allele after 500 generations (on the basis of the mean of 100 runs using the same parameter values). The modifier allele m is codominant and induces free recombination in homozygotes, while the resident allele M induces no recombination. The contours give the final frequency of m, given an initial frequency of 0.5. Observe that the area where recombination is favored in the host corresponds to parameter values where the parasite is relatively more locally adapted (a). Other parameter values:
  ,
,  ,
,  ,
,  , and
, and  .
.

