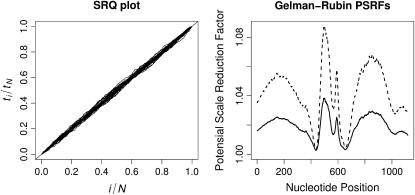
Figure 5.—
Convergence diagnostics. The left plot depicts 42 scaled regeneration quantile (SRQ) plots, where ti denotes an iteration, at which the total number of breakpoints in individual alignments returns to its posterior median for the ith time. Gelman–Rubin potential scale reduction factors (PSRFs, solid line) and their corresponding 97.5% quantiles (dashed line) for recombination log odds  are plotted against site indexes on the right.

