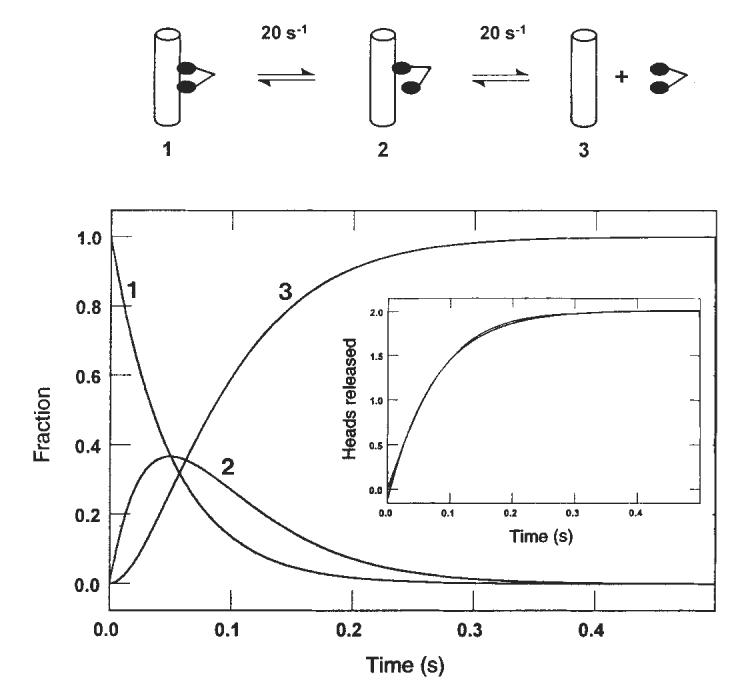
FIG. 6.

Sequential release of the kinesin heads from the microtubule. Computer modelling (KINSIM) of the kinetic data predicted the time courses shown as dimeric kinesin progresses through a complete cycle (2 ATPs hydrolysed). Curve 1 represents the species with both kinesin heads bound to the microtubule. Curve 2 shows the appearance of the intermediate that results after the first head is released, and curve 3 shows the appearance of the intermediate in which both heads are dissociated from the microtubule. Inset: simulated kinetics of the sequential release of two heads, with each species contributing equally to the signal and each step occurring at 20 s−1. Superimposed on this trace is the best fit to a single exponential giving a rate of 13.3 s−1.
