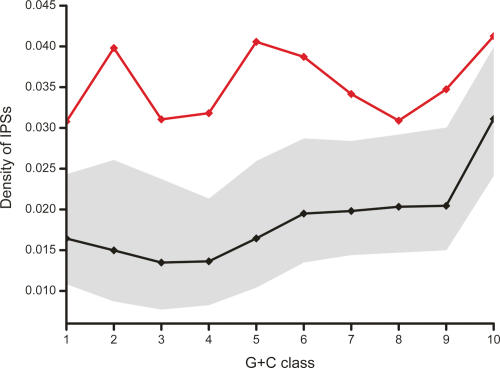
Figure 2.
Density of indel-purified segments in macroRNA transcripts. Shown are the IPS densities within macroRNA transcripts (red line) for 10 G+C content bins (horizontal axis), and the expected density based on the intergenic distribution of IPSs (black line; the gray band indicates 95% confidence intervals obtained by randomization; see Methods for details). The IPS densities within macroRNAs exceed significantly the levels expected in G+C-matched intergenic sequence, indicating the past action of purifying selection.

