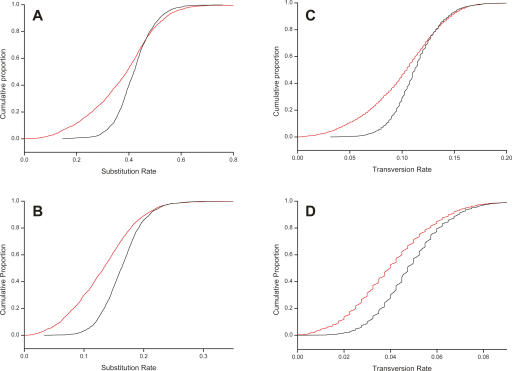
Figure 3.
Strong conservation of macroRNA promoters. Panels show the cumulative distributions of substitution (A,B) and transversion rates (C,D), as measured on the core putative promoter regions of macroRNA transcripts (red curves; 0–400 bp upstream of transcription start site), and the same rates on nearby AR sequence of the same length (black curves). Mouse macroRNA putative core promoter regions exhibit significantly suppressed substitution and transversion rates compared to selectively neutral ARs (P < 10−15 for all panels). This is true both for mouse–human (A,C) and mouse–rat (B,D) comparisons.

