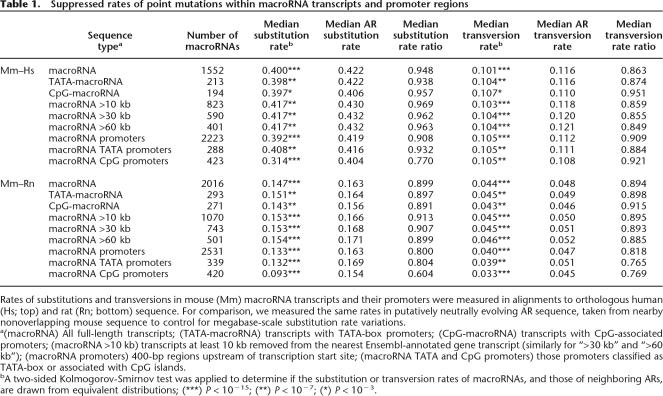
Table 1.
Suppressed rates of point mutations within macroRNA transcripts and promoter regions
Rates of substitutions and transversions in mouse (Mm) macroRNA transcripts and their promoters were measured in alignments to orthologous human (Hs; top) and rat (Rn; bottom) sequence. For comparison, we measured the same rates in putatively neutrally evolving AR sequence, taken from nearby nonoverlapping mouse sequence to control for megabase-scale substitution rate variations.
a(macroRNA) All full-length transcripts; (TATA-macroRNA) transcripts with TATA-box promoters; (CpG-macroRNA) transcripts with CpG-associated promoters; (macroRNA >10 kb) transcripts at least 10 kb removed from the nearest Ensembl-annotated gene transcript (similarly for “>30 kb” and “>60 kb”); (macroRNA promoters) 400-bp regions upstream of transcription start site; (macroRNA TATA and CpG promoters) those promoters classified as TATA-box or associated with CpG islands.
bA two-sided Kolmogorov-Smirnov test was applied to determine if the substitution or transversion rates of macroRNAs, and those of neighboring ARs, are drawn from equivalent distributions; (***) P < 10−15; (**) P < 10−7; (*) P < 10−3.

