
Figure 4.
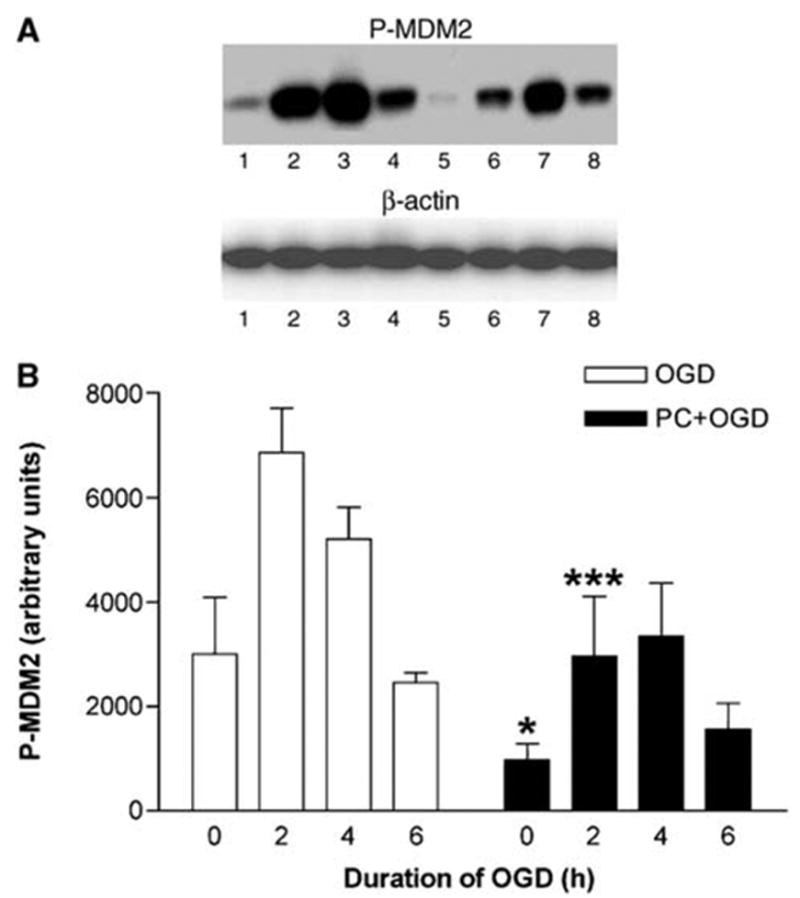
Effect of preconditioning on P-murine double minute 2 (MDM2) in PC12 cells exposed to oxygen and glucose deprivation (OGD). (A) Representative Western blot of P-MDM2 levels in cells exposed to OGD for 0, 2, 4, and 6 h without and with preconditioning (lanes 1, 2, 3, and 4, and lanes 5, 6, 7, and 8, respectively). Reblotting with anti-β-actin was performed as loading control. (B) Quantitative densitometric analysis of the effect of preconditioning on P-MDM2 levels in PC12 cells exposed to OGD. Results represent means + s.e.m. (n = 4) of P-MDM2 levels in cells exposed to OGD for 0, 2, 4, and 6 h without and with preconditioning (OGD and PC + OGD, respectively). A significant difference was obtained among the values of preconditioned and non-preconditioned cells during 0 and 2 h of OGD. *P < 0.05 and ***P < 0.001, compared with OGD values; bifactorial repeated measures analysis of variance.