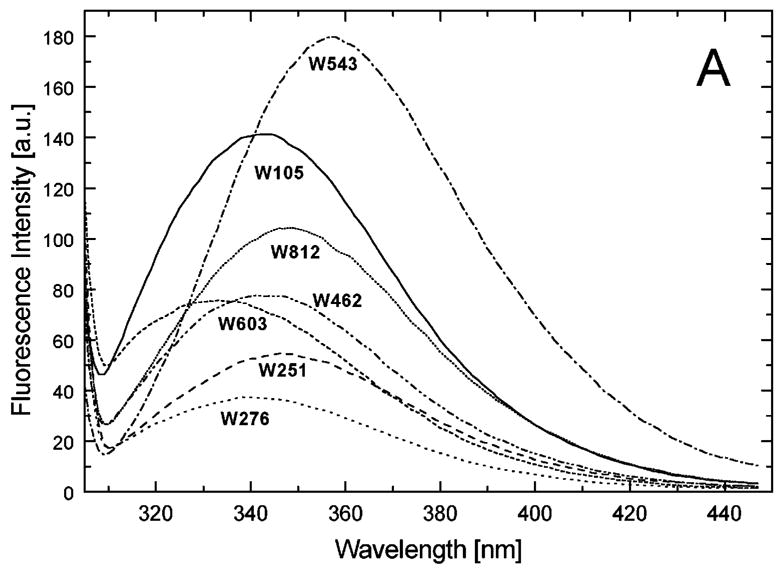
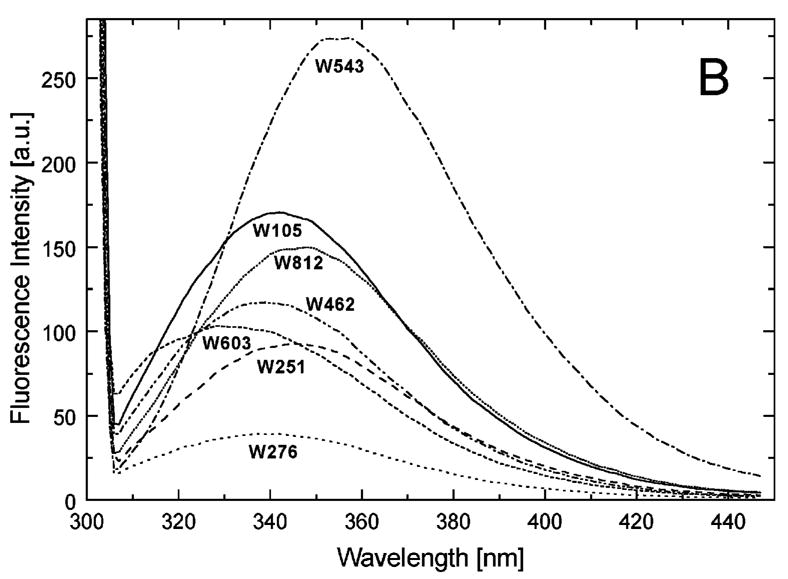
Figure 4.


Fluorescence emission spectra of the single-Trp variants of ClpB. The excitation wavelength was 300 nm and the emission spectra were measured for each of the variants of ClpB indicated in the figure at 0.1 mg/ml in buffer A (50 mM Tris/HCl pH 7.5, 20 mM MgCl2, 1 mM EDTA, 1 mM DTT) with 0.3 M KCl (A) or at 0.5 mg/ml in buffer A without KCl (B).
