Figure 5.
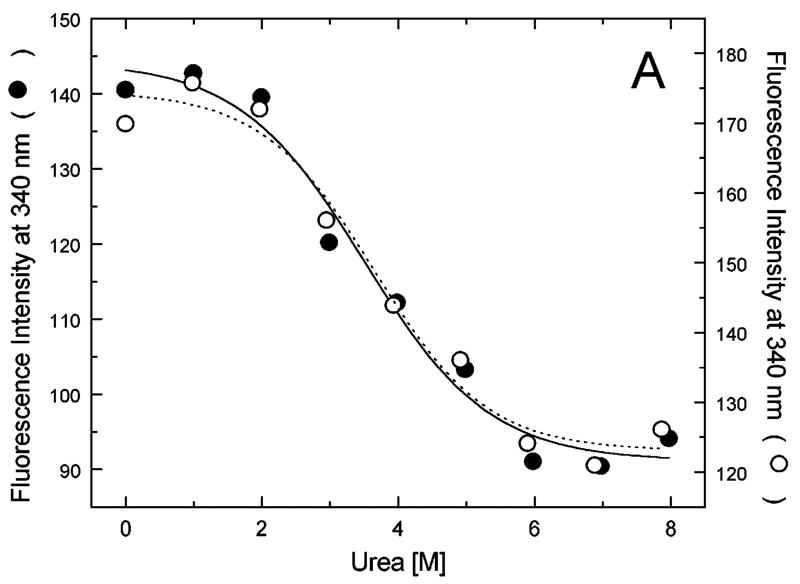
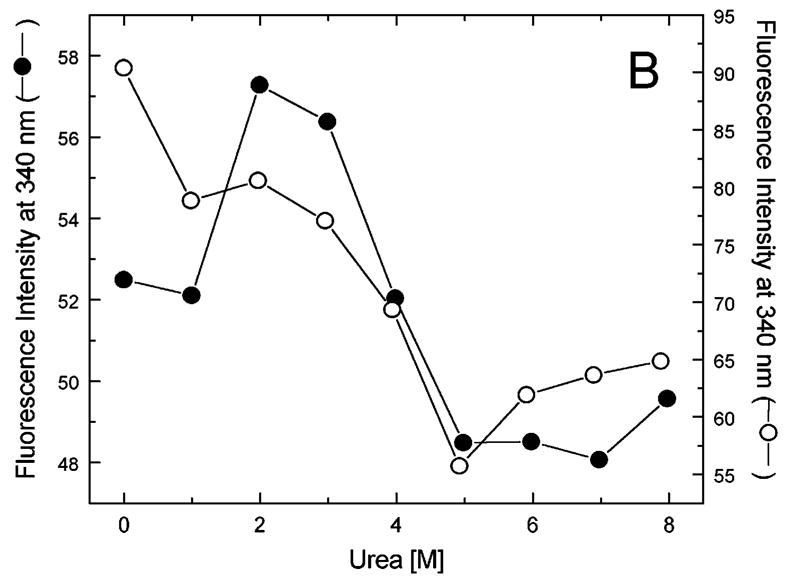
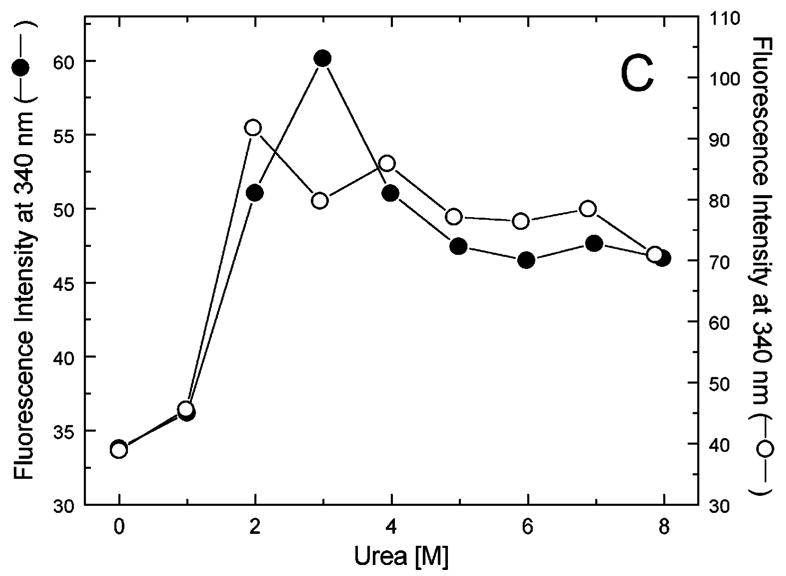
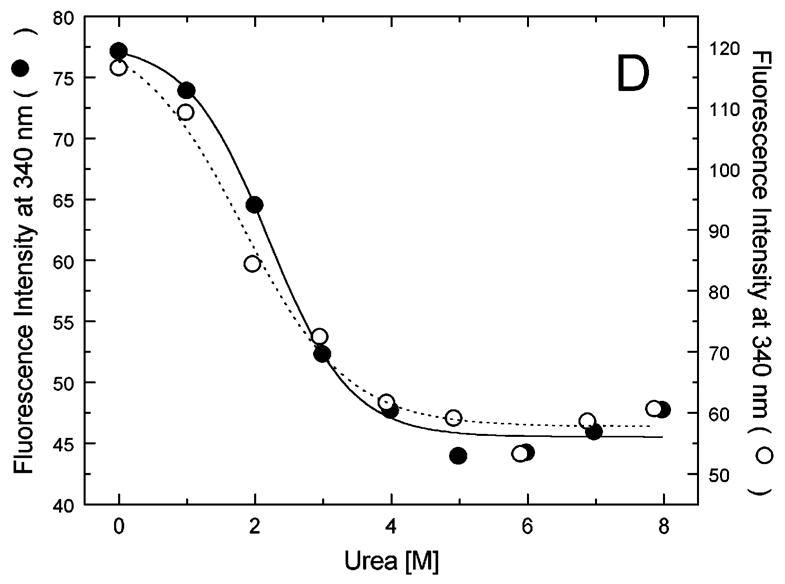
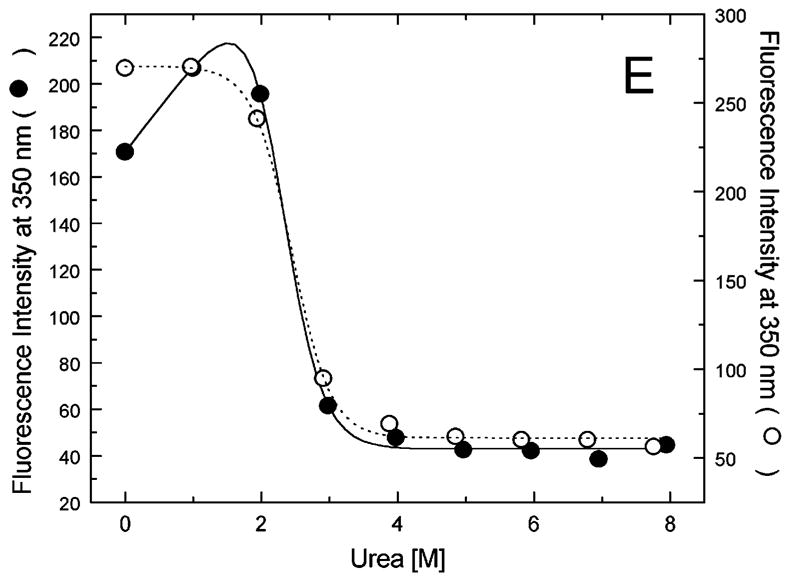
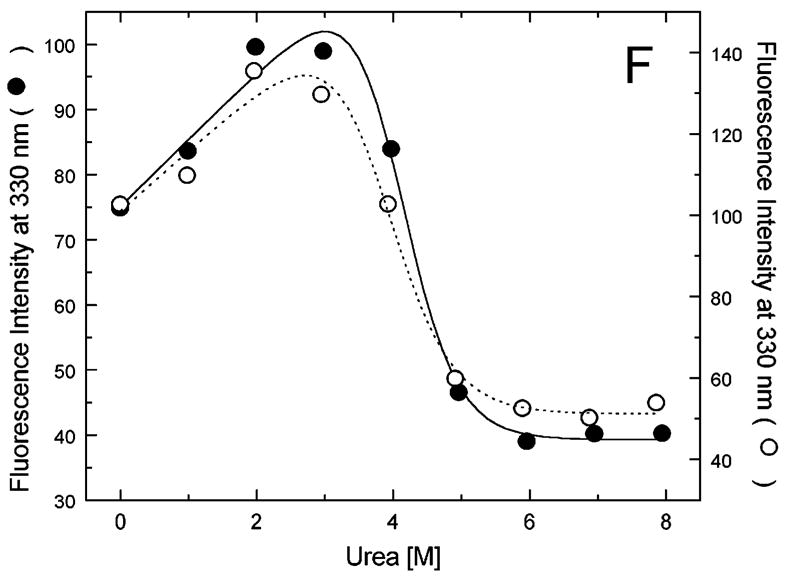
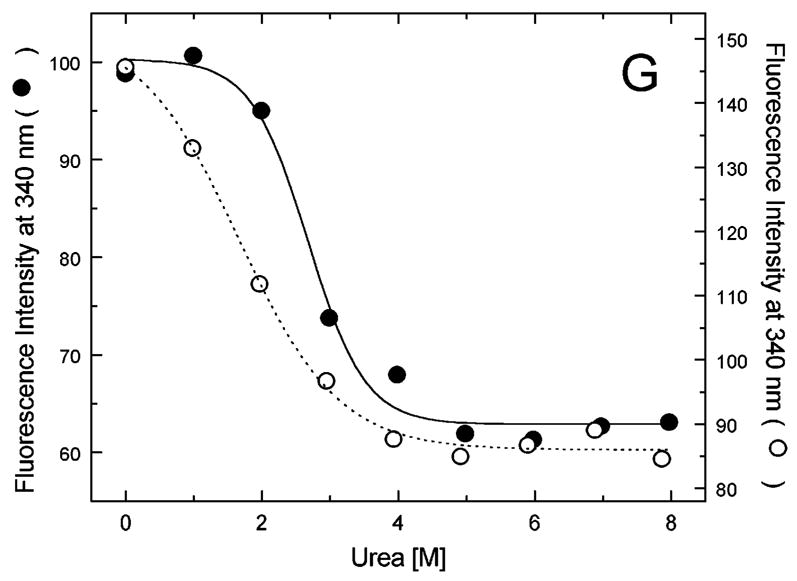
Urea-induced changes of fluorescence intensity in single-Trp ClpB variants. Shown are the data for monomeric ClpB (0.1 mg/ml in 50 mM Tris/HCl pH 7.5, 20 mM MgCl2, 1 mM EDTA, 1 mM DTT with 0.3 M KCl and indicated urea concentrations, filled symbols) and oligomeric ClpB (0.5 mg/ml in 50 mM Tris/HCl pH 7.5, 20 mM MgCl2, 1 mM EDTA, 1 mM DTT with indicated urea concentrations, open symbols). The emission intensity was measured at equilibrium for the ClpB variants containing Trp at the following positions: W105 (A), W251 (B), W276 (C), W462 (D), W543 (E), W603 (F), and W812 (G). In panels A and D through G, shown are the nonlinear least-squares fits of the data using the two-state unfolding model (see text) for monomeric ClpB (solid line) and for oligomeric ClpB (dotted line).
