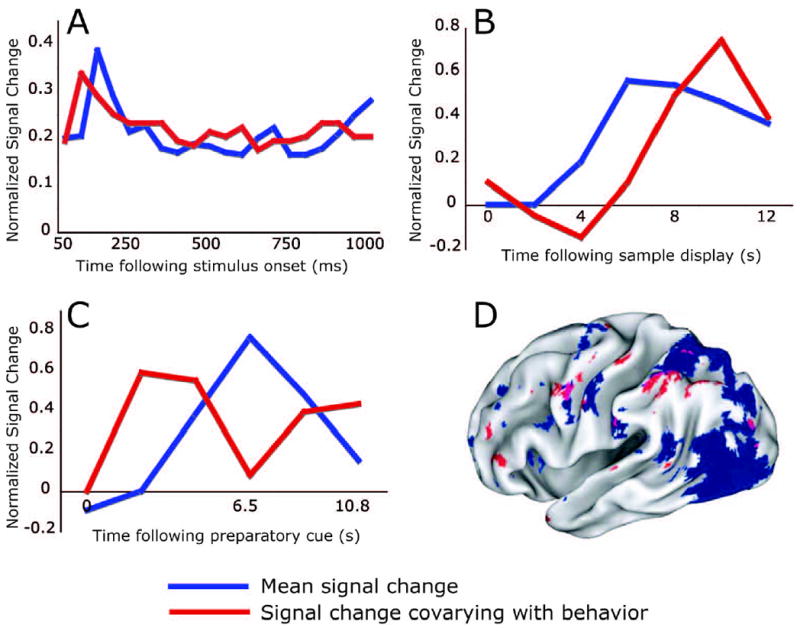
Figure 1.

Timecourses of mean activity and the component of mean activity that varies with behavior (A-C). In each panel, blue lines represent average activity modulation over all trials (A) or over all correct trials (B,C) in the epoch of interest. Red lines indicate the component of this signal that varied with performance, as measured by the ability of the signal at each time point to predict trial accuracy. All data were normalized to allow mean and predictive timecourses to be drawn on the same plots. (A) Single-unit recordings from MST following presentation of a motion stimulus (Heuer & Britten, 2004). Note that in this stimulus-evoked activity, the predictive component closely follows the mean signal. (B) BOLD activity in the right intraparietal sulcus following presentation of a visual stimulus to be held in working memory (Pessoa et al., 2002). (C) BOLD activity in MT following a spatial cue indicating the probable location of an upcoming motion stimulus (Sapir et al., 2005). Note that in these preparatory signals (B,C) the predictive component of the signal differs from the mean signal. Panel D displays a map highlighting brain regions with consistent preparatory signals averaged over trials (blue) and regions whose preparatory activity was most predictive of performance (red) (Sapir et al., 2005). Purple indicates overlap. Note the spatial segregation between these signals.
Figure 1A modified, with permission, from figures 5A and 9 from Heuer and Britten (2005). Figure 1B modified, with permission, from figures 3B and 4 from Pessoa et al. (2002). Figure 1C modified, with permission, from figure 5A from Sapir et al. (2005). Figure 1D modified, with permission, from figure 2C from Sapir et al. (2005).
