
Fig. 5.
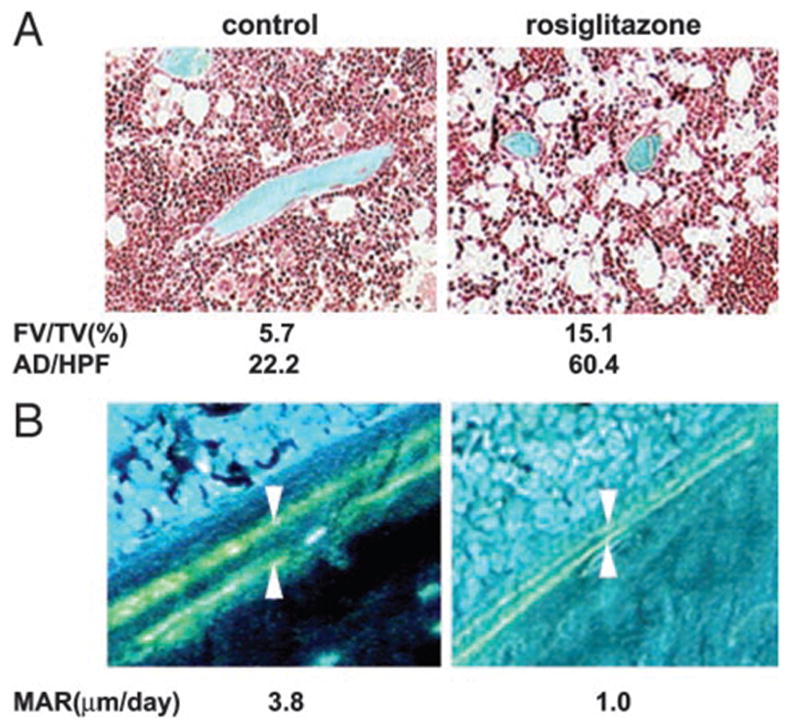
Representative photomicrographs of cancellous tibia. Numbers represent average of six representative fields examined from the same bone. A, Bone sections stained with Goldner trichrome stain. Mineralized bone tissue is stained blue, whereas the unstained area in the bone marrow represents empty spaces previously occupied by adipocytes. Photomicrographs were obtained on the Osteometrics system using a ×10 objective. B, Tetracycline-labeled section of the proximal tibia. The distance between two layers of tetracycline labels (arrows) visualized by epifluorescence represents bone formation that occurred during the 5-d period between tetracycline injections. Photomicrographs were obtained on the Osteometrics system using a ×40 objective. AD/HFP, Number of adipocytes per high-power field.