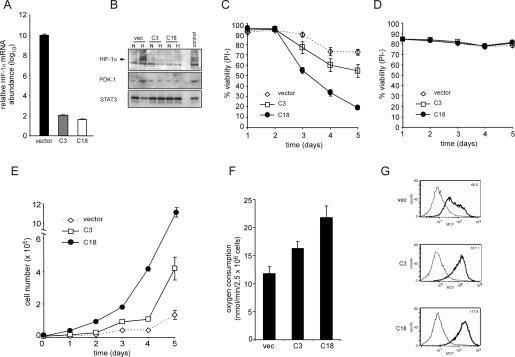
Figure 4.
Cells expressing stable shRNA targeting HIF-1α have impaired survival but enhanced proliferative capacity. (A) Real-time qPCR analysis of Hif-1α mRNA levels. RNA from cells was isolated and cDNA synthesis was performed as described in the Materials and Methods section. Data are a representative experiment. (B) Western blotting of HIF-1α and PDK-1 in clones stably expressing shRNA to HIF-1α after culturing for 4 h in normoxic (N) or hypoxic (H) conditions. Lysates from vector cells cultured in the presence of IL-3 and exposed to 100 μM CoCl2 were used as a positive control. (C) Viability of HIF-1α knockdown cells grown in the presence of IL-3 cultured under hypoxic condition. At each time point, cells were collected and viable cells were assessed by staining with propidium iodide. Data represent mean of three independent experiments ± SD. (D) Viability of HIF-1α knockdown cells grown in the absence of IL-3 cultured under hypoxic condition. At each time point, cells were collected and viable cells assessed by staining with propidium iodide. Data represent mean of three independent experiments ± SD. (E) Growth curves of IL-3-stimulated cells expressing stable HIF-1α knockdown cultured under normoxic conditions. Data are a representative experiment performed in triplicate ± SD. (F) The rate of oxygen consumption under normoxia was measured in HIF-1α knockdown cells cultured in the presence of IL-3. Data are a representative experiment performed in triplicate ± SD. (G) Mitochondrial membrane potential was measured in cells cultured in the presence of IL-3 using the potentiometric dye TMRE. The value in the top right corner is a representative value of the mean channel fluorescence (MCF). Unstained cells and stained cells are represented by light and bold histograms, respectively.

