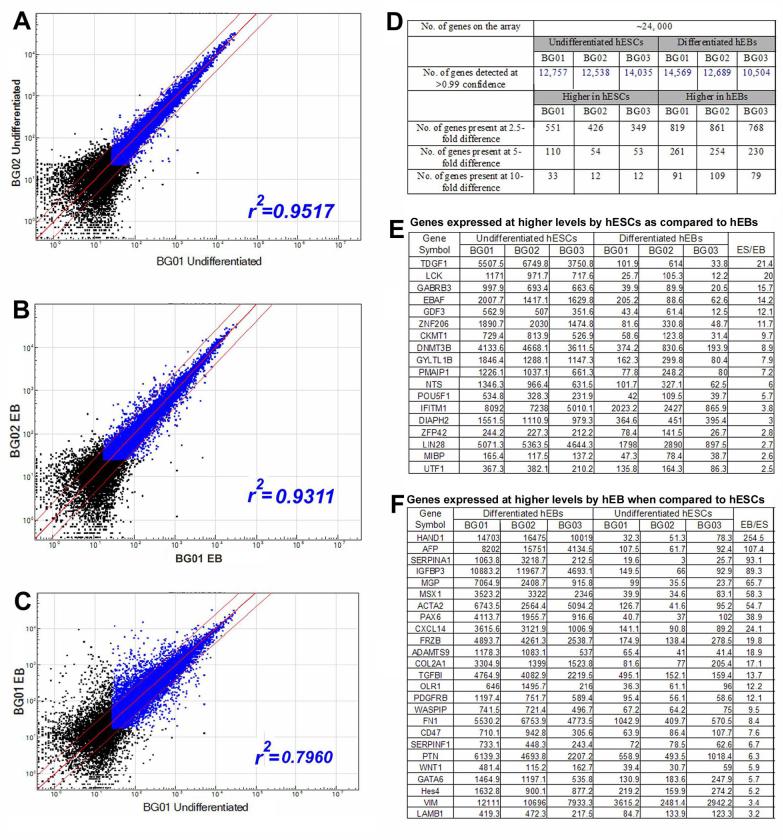
Fig 4.
Assessment of potential hESC and EB markers using microarrays. Three different ESC lines (BG01, 02 and 03) and 14-day EBs that differentiated from them were compared using an Illumina Bead array. (A-B) Comparisons of gene expression among three hESC lines or three EBs show similar levels with a correlation coefficient (r2) greater than 0.93. (C) Pairwise comparisons of undifferentiated hESCs with their matched EBs reveal that about 50% of the genes are expressed with at least a 2.5-fold difference. (D) Summary of the numbers of genes detected in this array. (E-F) Selected genes that are differentially expressed in three hESC lines (BG01, 02 and 03) and in their matched EBs. Note that only the genes that are detected at >0.99 confidence (blue dots) are considered valid for further analysis. Dots that fall between the thin red lines represent genes that are commonly expressed in hESCs and EBs, while dots outside red lines correspond to differentially expressed genes at >2.5 fold.

