
Figure 3. K13 and K289 are major sites of PTEN ubiquitination.
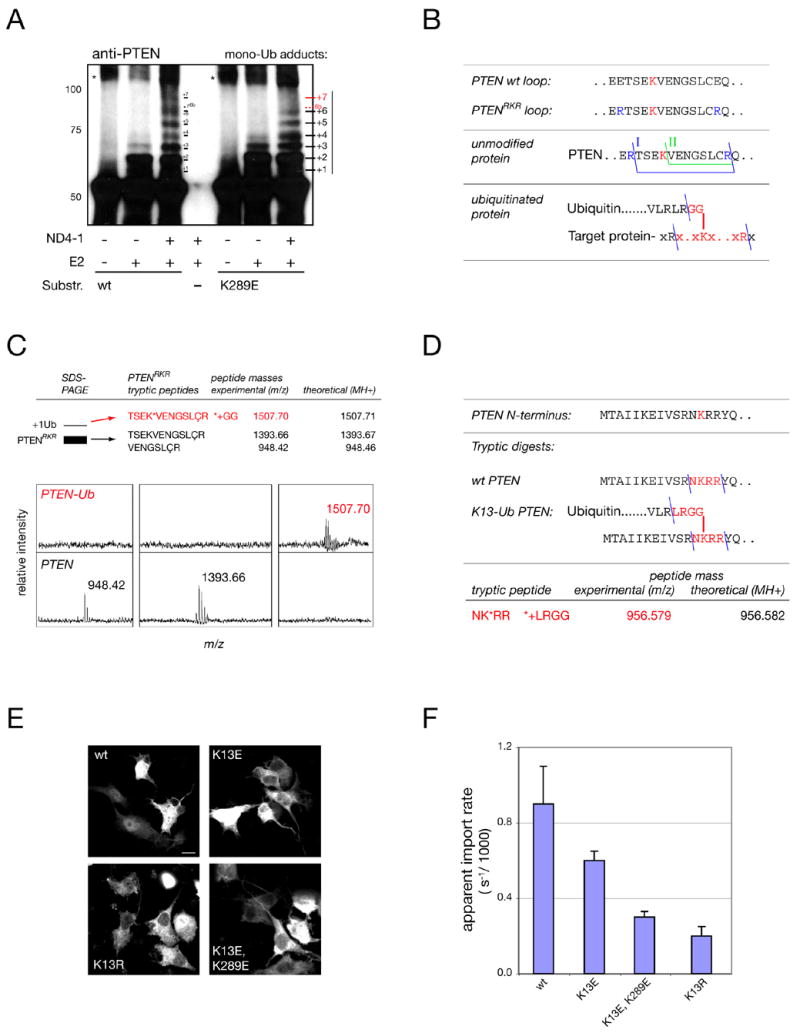
(A) In vitro PTEN mono-ubiquitination assays using NEDD4-1 E3 ligase (ND4-1) reveal several target sites in wt PTEN and loss of at least one corresponding target site(s) (“+7/ 6b”) in the K289E mutant (red). Note that numbering reflects only an estimate of the true adduct-number. Asterisks denote non-Ub specific aggregates. Molecular weights in kD.
(B) Top: location of engineered tryptic sites for mass spectrometry identification in PTENRKR. Middle: the two expected tryptic C2-loop fragments for PTENRKR (I, II). Bottom: expected fragment for K289-ubiquitinated PTENRKR (red).
(C) Mass spectrometry of PTENRKR and the first adduct band reveals the expected fragments for unmodified PTEN and PTEN ubiquitinated at K289 (upper panels, red). Lower panels show spectra of unmodified and modified PTEN with masses. ‘Ç’ denotes cysteine-acryl-amide (see Experimental Procedures).
(D) Mass spectrometry of immunoprecipitated PTEN after overexpression in cells reveals the peptide expected for a tryptic Ub adduct on lysine 13.
(E) Immunofluorescence staining of gfp-tagged K13 mutants. Scale bar, 10 μm.
(F) FRAP and quantification of the apparent import rates of mutants visualized in (E). Error bars show S. D.