
Fig. 3.
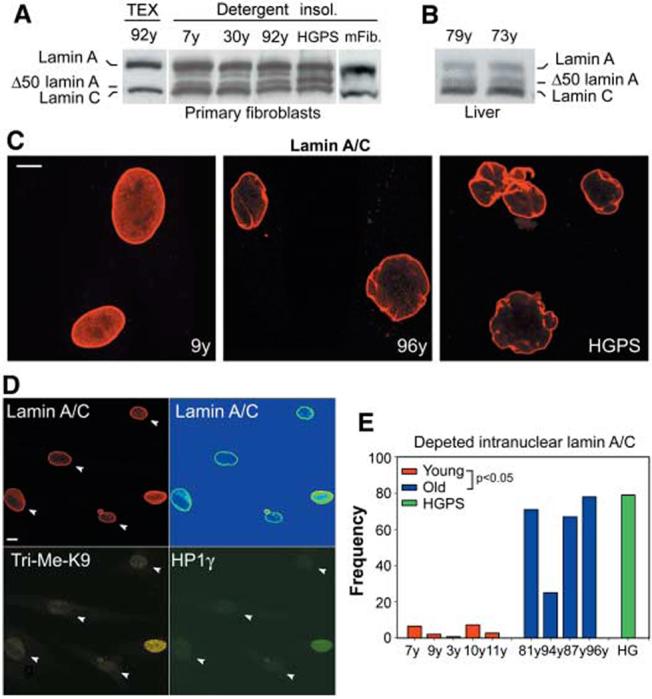
Accumulation of lamin A/C at the lamina in cells from old individuals. Western blot analysis of total protein extract and detergent insoluble fraction of fibroblasts from (A)healthy individuals of indicated age, a HGPS patient, and mouse fibroblasts and (B) from liver from healthy individuals probed with antilamin A/C. Δ50 lamin A is not detected in mouse fibroblasts. A fourth protein consistent with Δ10 lamin A (15) is also detected. Equal loading was verified by Coomassie staining of the blot. (C and D) Immunofluorescence confocal microscopy on passage-matched (PD21) fibroblasts. (D) Co-staining of fibroblasts from an old individual. Scale bar, 10 μm. Lamin A/C signal shown in intensity pseudocolors in upper right image. Arrowheads indicate nuclei with depleted nucleoplasmic lamin A/C and reduced amounts of HP1γ and Tri-Me-K9H3. (E) Quantitation of percentage of cells showing depletion of nucleoplasmic lamin A/C (average fluorescence intensity ratio nucleoplasm/lamina < 0.2) in passage-matched (PD21) cell lines from healthy individuals of indicated age and a HGPS patient.