
Figure 13.
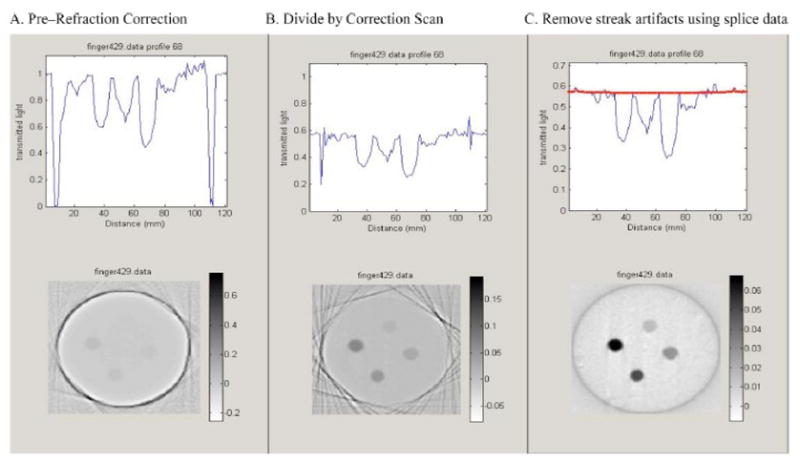
Upper figures illustrate an arbitrary projection, at different stages of correction, and the lower figures are the corresponding reconstructed slice. (A) uncorrected data, (B) after division by the ‘pre-scan’ projection data acquired before irradiation, and (C) final result after further correction for edge artifacts caused by small positional errors between pre and post projections.