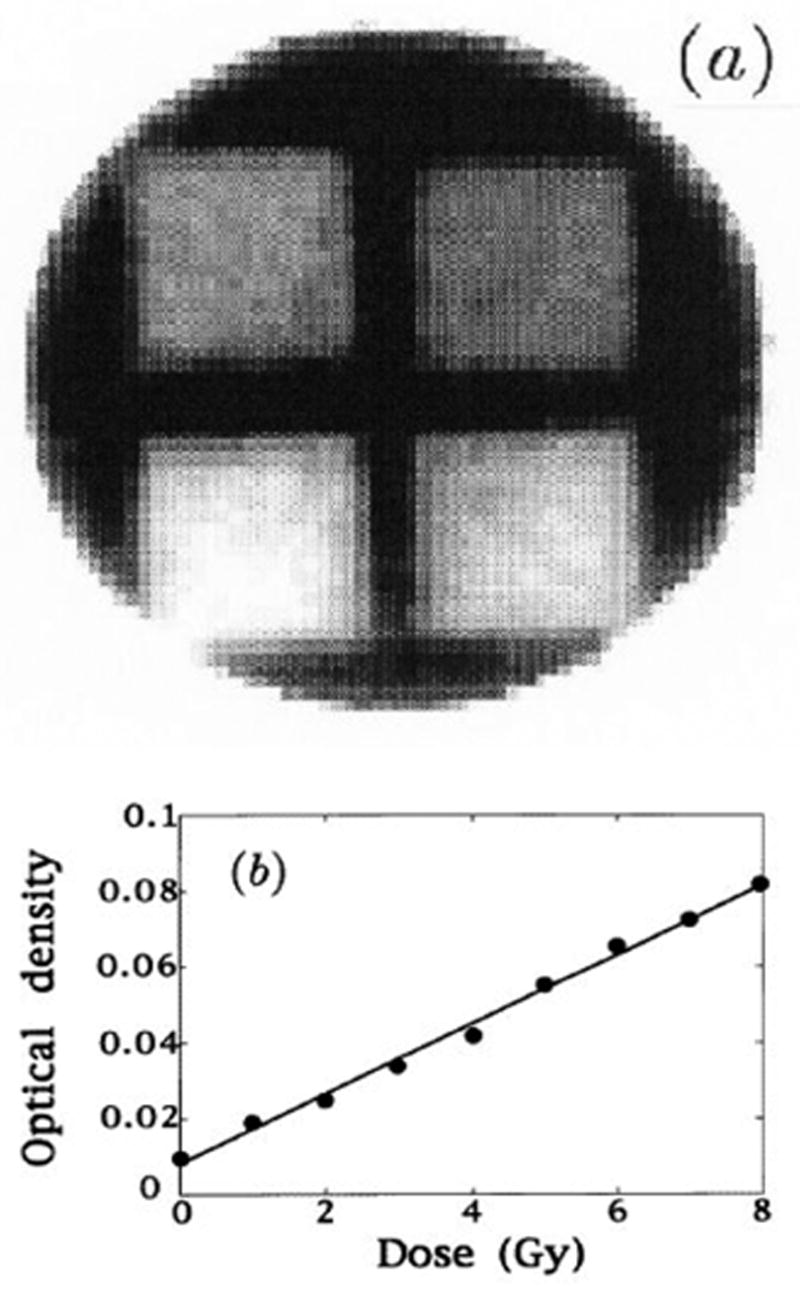
Figure 2.

Optically scanned 2D dose distribution of irradiated polymer gels (a) the calculated dose map of a cylindrical sample of radius 10cm in which four rectangular fields of different doses were placed; (b) the relationship of optical attenuation to dose. (From [2]).
