
Figure 3.
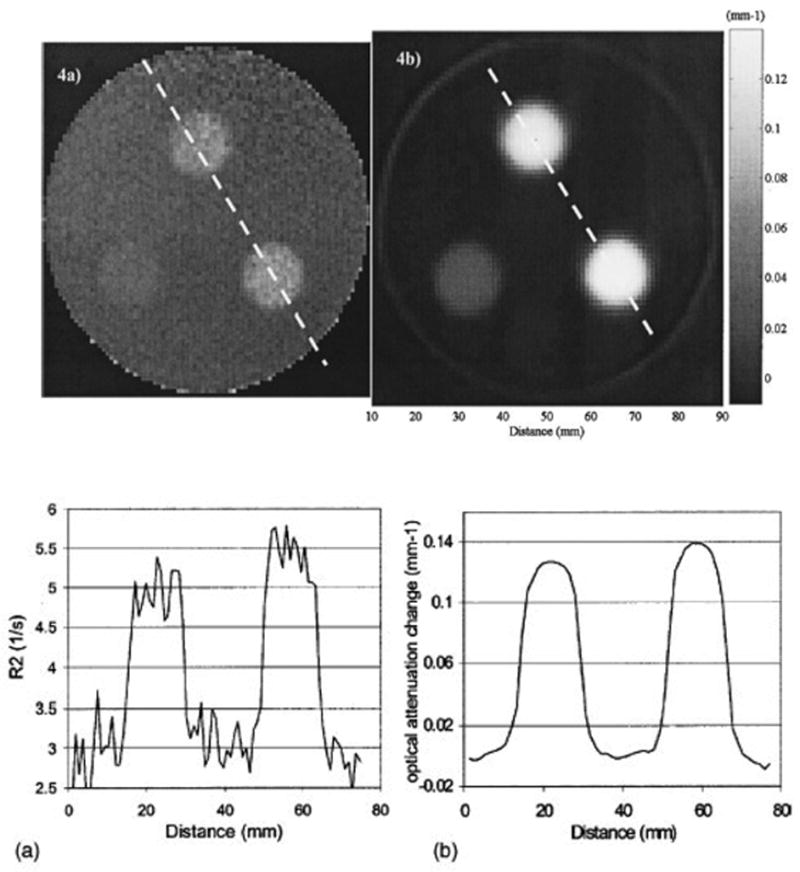
Axial images through the same plane of the same cylindrical polymer gel-dosimeter irradiated with 3 circular radiosurgery beams. (a) MRI image of the R2 distribution, (b) optical-CT image of the districution of optical attenuation coefficients. The corresponding profiles along the dashed lines are shown in (c) and (d) respectively. (From [6]).