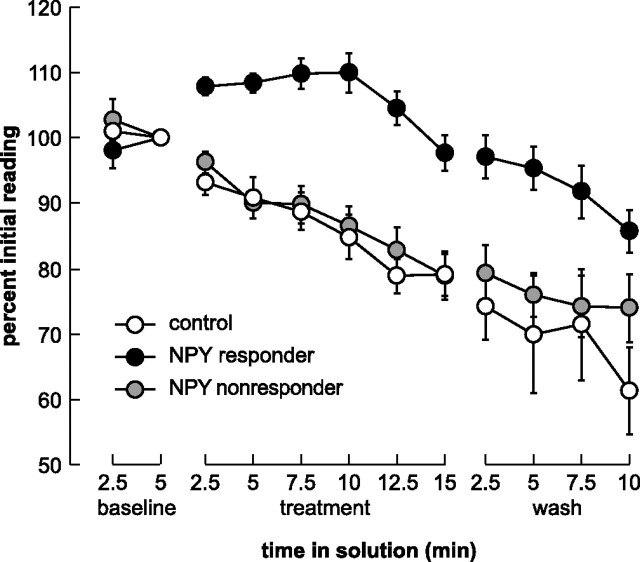
Figure 6.
Change over time in the magnitude of the inward current of olfactory receptor neurons from hungry animals exposed to 100 nm synthetic axolotl NPY or a control solution (fast green). Data were normalized such that the magnitude of the inward current immediately before application of the test solution was designated 100%, and the magnitude of the current at other times is expressed as a percentage of the magnitude at this time point. “Baseline” refers to the initial recording period, “treatment” indicates the time at which NPY or the control solution was washed onto the slice, and “wash” indicates the period during which the solution was washed off. Means and SEs are shown for cells exposed to the control solution (open circles; n = 4) or NPY (filled circles); the black circles indicate cells classified as “responders” (n = 7), and gray circles indicate “nonresponders” (n = 11). After 2.5 min in NPY, the magnitude of the inward current was significantly larger in cells responding to NPY than in control cells and nonresponders; the current decreased but did not recover during the 10 min wash period. All recordings were made with CsCl in the intracellular solution and BaCl2 in the extracellular solution.

