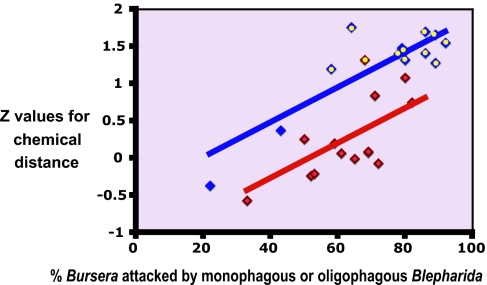
Fig. 6.
Standardized average chemical distances for 27 Bursera communities in the seven geographic areas studied vs. percentage of Bursera species that are attacked by monophagous or oligophagous Blepharida. Blue squares indicate communities that develop at altitudes up to 1,000 m. Red squares indicate larger communities that develop at altitudes up to 2,200 m. Yellow dots indicate communities in which chemical defenses are statistically more dissimilar than random. Regression lines for small and large communities were fit simultaneously adjusting for correlated error structure (assuming local, compound symmetric error covariance; see Methods).

