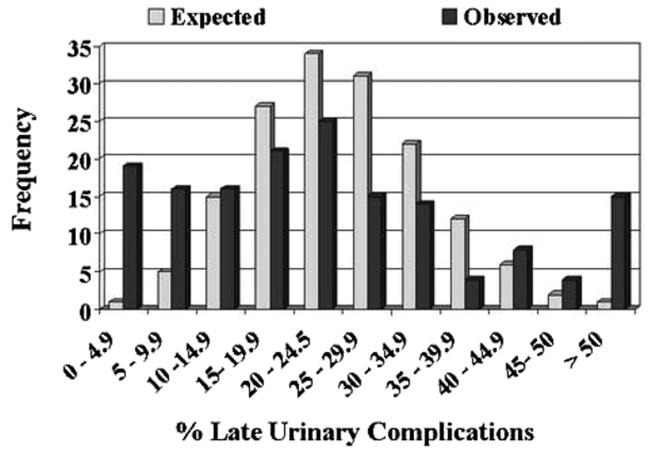
FIG. 2.
For each grouped late urinary complications rate (by cells of 5%), histograms juxtapose observed and expected number of surgeons (p <0.001). More outliers on right side of histogram in observed vs expected plot highlight providers achieving poor outcomes. Conversely, outliers toward left in observed vs expected plots indicate surgeons achieving more favorable outcomes. Modified from Panageas et al.9

