
Fig. 5. Overexpression of the c-FLIP Gene in Prostate Cancer.
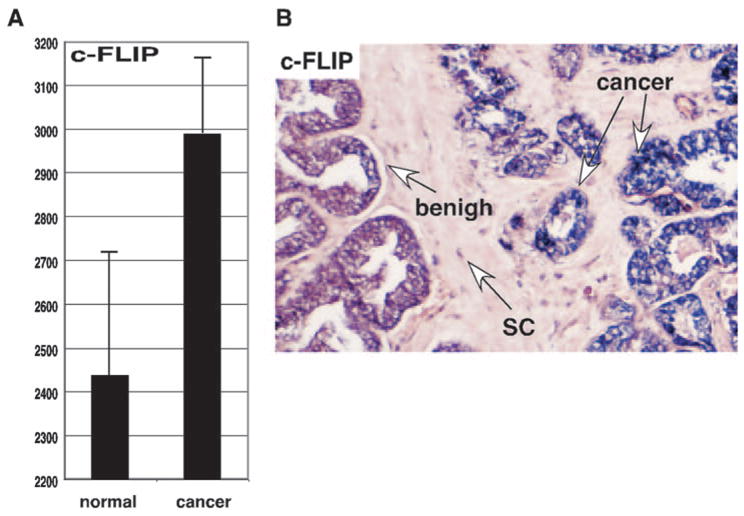
A, DNA microarray analysis of expression of the c-FLIP gene in normal prostate and cancerous tissue. y-Axis represents gene expression values (means ± SD) determined by default settings of Affymetrix Microarray Suite 4.0. B, The slides were hybridized with the digoxigenin-labeled RNA probes of c-FLIP. Positive signal is purple/blue, and the negative cells are colorless/light pink. SC, Prostatic stromal cells.